

The best data we have to look at where jobs are growing over time come to us at the municipal level.* This isn’t great for getting a sense of whether employers are migrating to locations with strong transit service—ideally we’d have job counts for Census tracts or smaller geographies that represent actual station areas—but it’s a start.
We looked closely at three categories of municipalities across the state based on their transportation infrastructure: those with MBTA subway stops, those with MBTA commuter rail stops, and those without public transit along interstate highways.
The picture we get is revealing (Figure 1). Communities with subway service accounted for 42 percent of all net job growth in Massachusetts over the last 10 years. During the previous 10-year period, communities with this high-frequency transit asset generated just 6 percent of the state’s net job growth. Between 2006 and 2016, subway communities produced 10 times as many jobs as they did from 1995 to 2005. Boston, was the big producer (going from 4 percent share to 29 percent share), but there have also been large gains relative to the 1990s to early 2000s in Brookline, Cambridge, and Somerville.
Figure 1: Share of state’s net job growth by transportation infrastructure
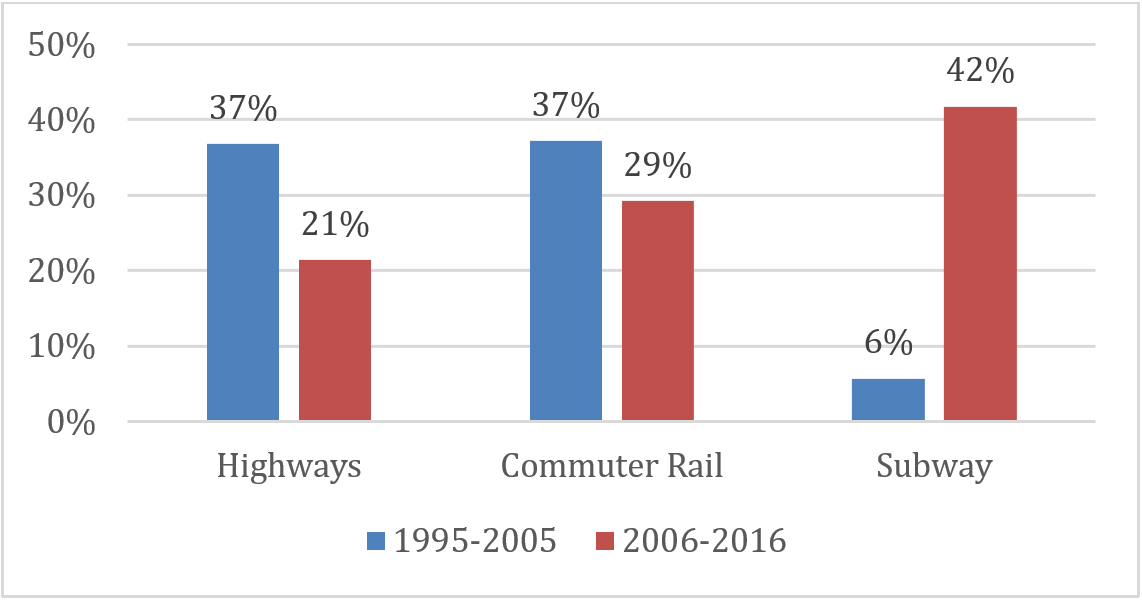
This performance stands in sharp contrast to communities along interstate highways. For decades, most new jobs cropped up along highway exit ramps, where land has been plentiful and freeways made it easy for commuters to get in and out of the office. But this trend has clearly abated. The share of net jobs in highway-only locations declined sharply, from 37 percent in the 1990s to just 21 percent over the past 10 years.
Figure 2: Net job growth by transportation infrastructure
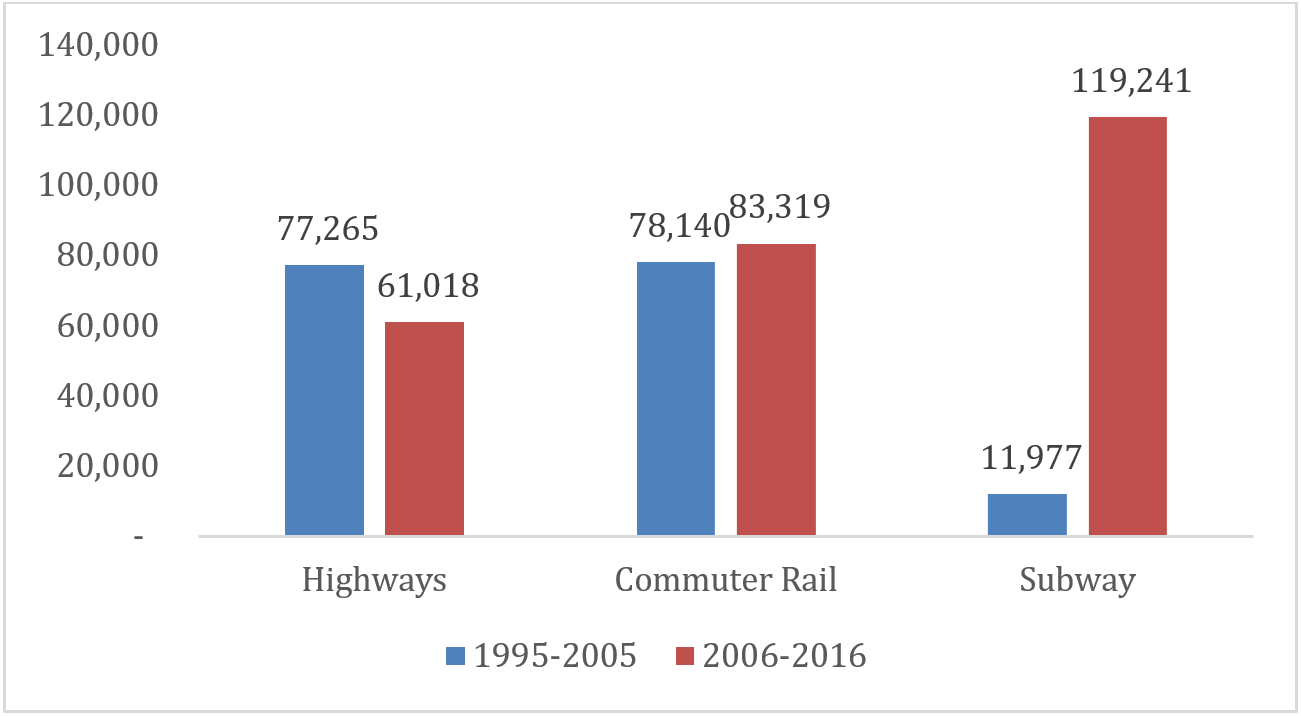
Communities with just commuter rail also lost share, but it’s notable that these places gained more jobs in the last 10 years than they did during the prior 10-year period (Figure 2). Net job growth in the interstate highway communities dropped by 21 percent, whereas commuter rail communities saw net job growth climb by 7 percent period-to-period.
Figure 3: Net job growth Gateway Cities vs. Suburban Commuter Rail Communities
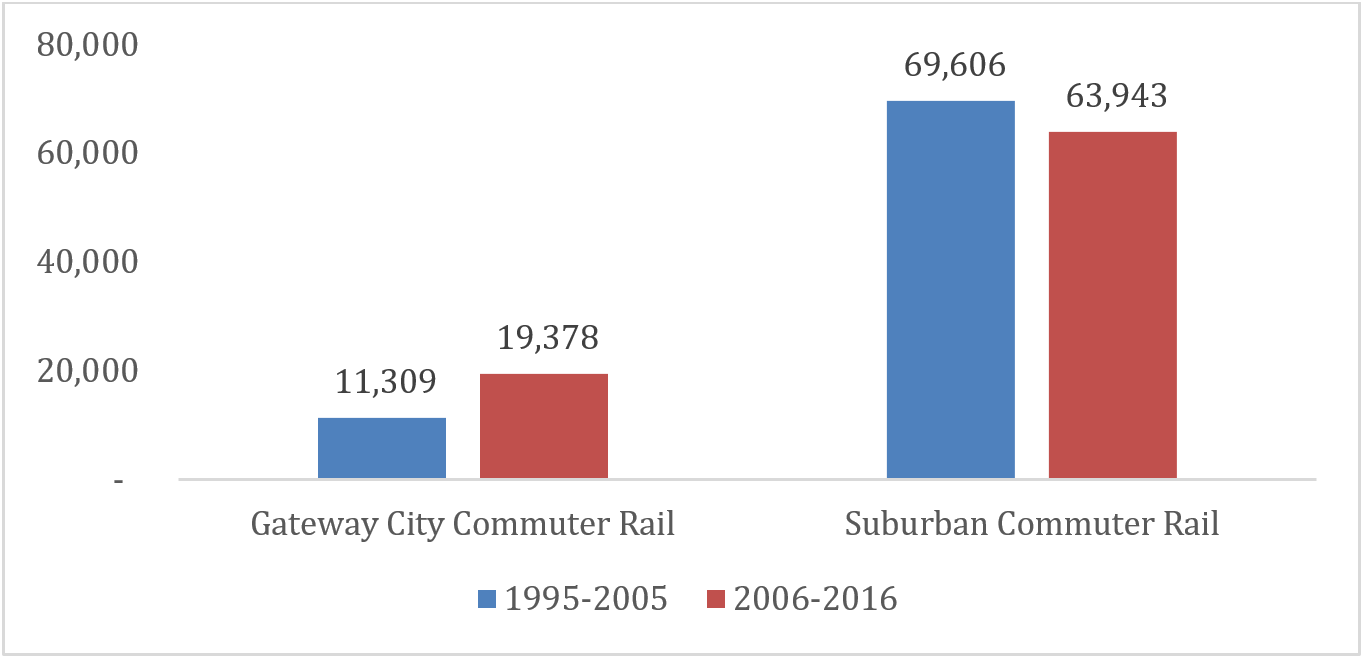
This could be an indication that commuter rail is spurring some commercial development and job growth. The fact that Gateway Cities with commuter rail did better than suburban commuter rail communities (Figure 3) offers evidence that walkable mixed-use urban centers with transit connectivity might be over-performing. Indeed, Lawrence and Worcester account for about half of the Gateway City gains, and these cities have seen major commercial development near their stations in recent years. Unfortunately, the MBTA does not collect passenger counts for reverse commuters (more evidence that the system is primarily operated for one-directional travel, fueling geographically uneven economic development), so it’s difficult to say for certain that outsized growth in these Gateway Cities had anything to do with transit connectivity.
* Census publishes ZIP Code Business Pattern going back to the 1990s. These offer long-term trends at the sub-municipal level. However we found many inconsistencies, perhaps due to changes in zip code boundaries, that made them unreliable for this analysis. The Census LEHD program offers block-level employment estimates. For Massachusetts, however, these figures are only available for 2010 through 2014.
Subway Municipalities: Boston, Braintree, Brookline, Cambridge, Malden, Medford, Milton, Newton, Quincy, Revere, Somerville.
Commuter Rail Municipalities: Abington, Acton, Andover, Ashland, Ayer, Belmont, Beverly, Billerica, Bridgewater, Brockton, Canton, Chelsea, Cohasset, Concord, Dedham, Easton, Fitchburg, Framingham, Franklin, Freetown, Gloucester, Grafton, Halifax, Hanson, Haverhill, Hingham, Holbrook, Ipswich, Kingston, Lakeville, Lawrence, Leominster, Lincoln, Littleton, Lowell, Lynn, Mansfield, Melrose, Natick, Needham, Newburyport, Norfolk, Norwood, Plymouth, Raynham, Reading, Rockport, Rowley, Salem, Scituate, Sharon, Shirley, Southborough, Stoughton, Swampscott, Taunton, Wakefield, Walpole, Waltham, Wellesley, Wenham, Westborough, Weston, Westwood, Weymouth, Whitman, Wilmington, Winchester, Woburn, Worcester.
Highway Municipalities: Amesbury, Auburn, Becket, Bellingham, Berlin, Bernardston, Blandford, Bolton, Boxborough, Boxford, Boylston, Brimfield, Burlington, Charlton, Chelmsford, Chicopee, Danvers, Dartmouth, Deerfield, Easthampton, Fairhaven, Fall River, Foxborough, Georgetown, Greenfield, Harvard, Hatfield, Holden, Holland, Holyoke, Hopkinton, Hudson, Lancaster, Lee, Lexington, Longmeadow, Ludlow, Lynnfield, Marion, Marlborough, Mattapoisett, Medway, Merrimac, Methuen, Middleborough, Middleton, Milford, Millbury, Montgomery, New Bedford, Newbury, North Andover, North Attleborough, Northampton, Northborough, Norton, Otis, Oxford, Palmer, Peabody, Plainville, Randolph, Rehoboth, Rochester, Russell, Salisbury, Seekonk, Shrewsbury, Somerset, Springfield, Sterling, Stockbridge, Stoneham, Sturbridge, Swansea, Tewksbury, Topsfield, Upton, Wareham, Warren, Wayland, Webster, West Boylston, West Newbury, West Springfield, West Stockbridge, Westfield, Westford, Westport, Whately, Wilbraham, Wilmington, Wrentham.