Another year of homes getting more expensive for Gateway City residents.
For generations, Gateway Cities have been the commonwealth’s affordable places to live, offering families a foothold in both the rental and homeownership markets. Affordability in these communities has mostly come from an abundance of naturally occurring affordable housing (NOAH)—older homes and apartments that rented or sold at prices within reach of working households. But as market pressures push rents and home values higher, this stock is at risk of disappearing; in some places, it has already vanished. With a dwindling supply of NOAH, cities increasingly rely on deed-restricted affordable housing to provide homes that residents can actually afford. This chapter tracks the gap between household income and current costs in the rental and for-sale markets, as well as the availability of affordable options. Together, these measures show how well Gateway Cities are doing ensuring that all residents have affordable pathways to stable housing and upward economic mobility.
Key Findings
Rent increases accelerated over the past year. On average, asking rents in Gateway Cities rose 6.6 percent from mid-2024 to mid-2025. This price increase was significantly faster than the 4 percent growth rate over the previous 12-month period. Rents increased at the fastest pace in lower-cost communities over the past year. In more expensive Gateway Cities near Boston, asking rents did not rise at all.
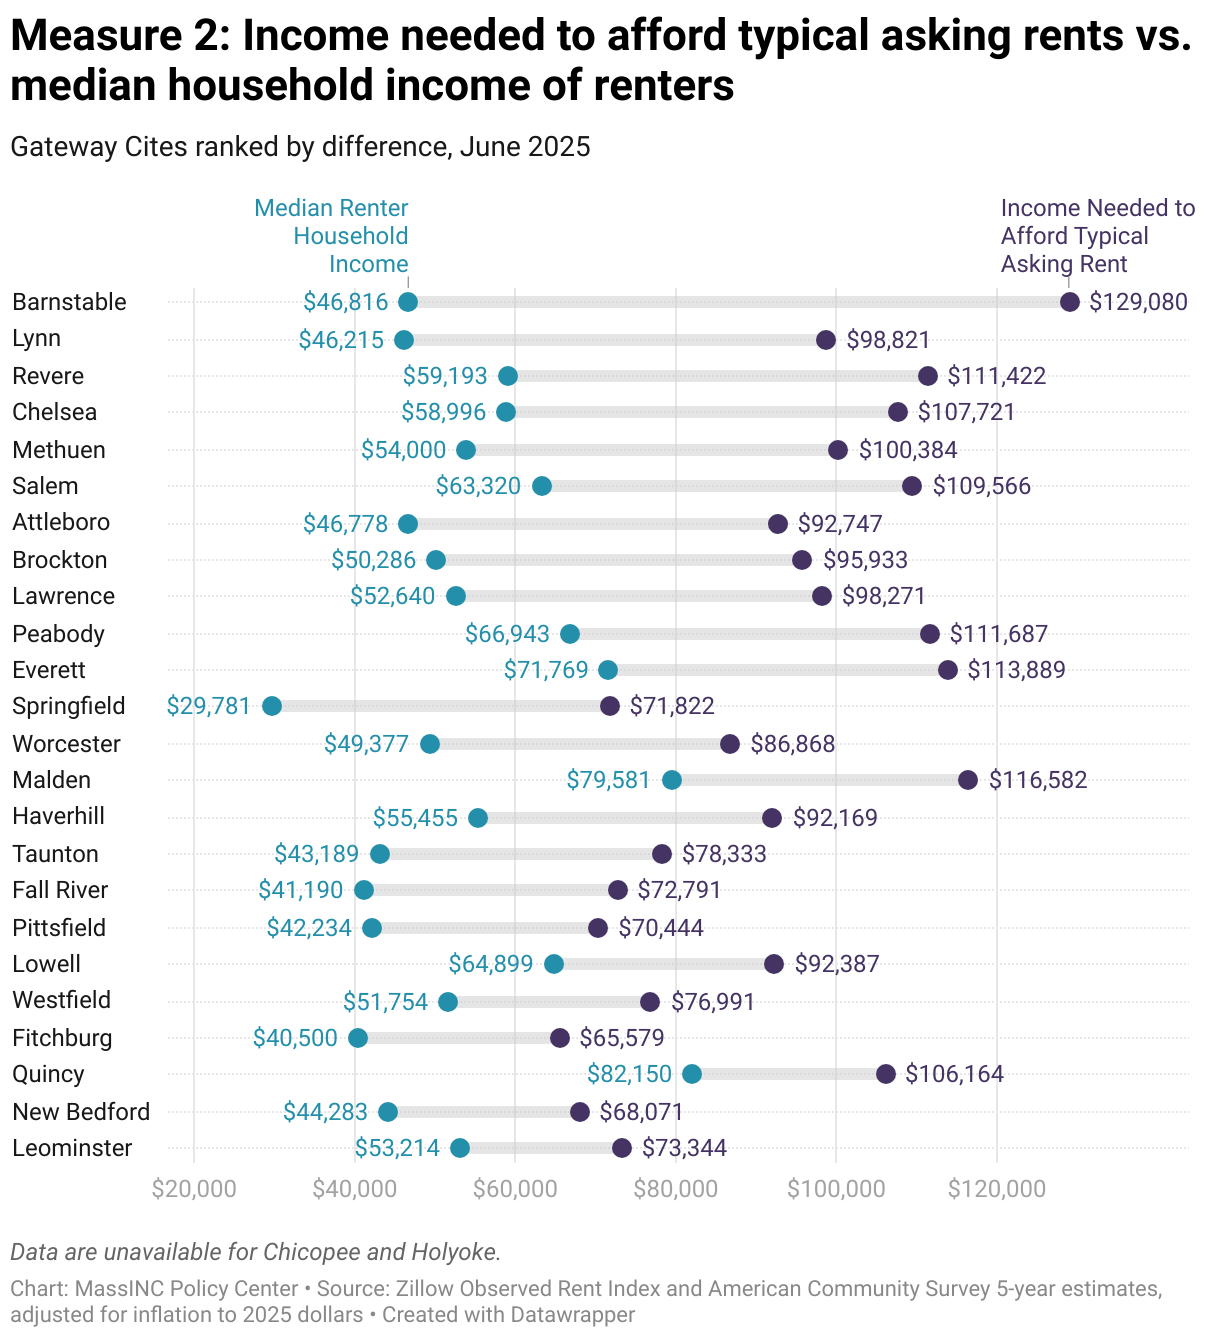
Asking rents are increasingly unaffordable for renters. The typical Gateway City renter household earns about $54,000 per year, but in 2025 it takes an annual income of $94,000 to afford the typical asking rent. This $40,000 shortfall is slightly wider than the $38,000 gap in 2024.
Growth in home values is moderating, but most Gateway City residents cannot afford to buy a home in their community. After a decade of 5 percent average annual gains, inflation-adjusted home values in Gateway Cities rose less than 1 percent from 2024 to 2025. But prices are still at historic inflation-adjusted highs; on average, just 20 percent of Gateway City households can afford to purchase the typical home in their community.
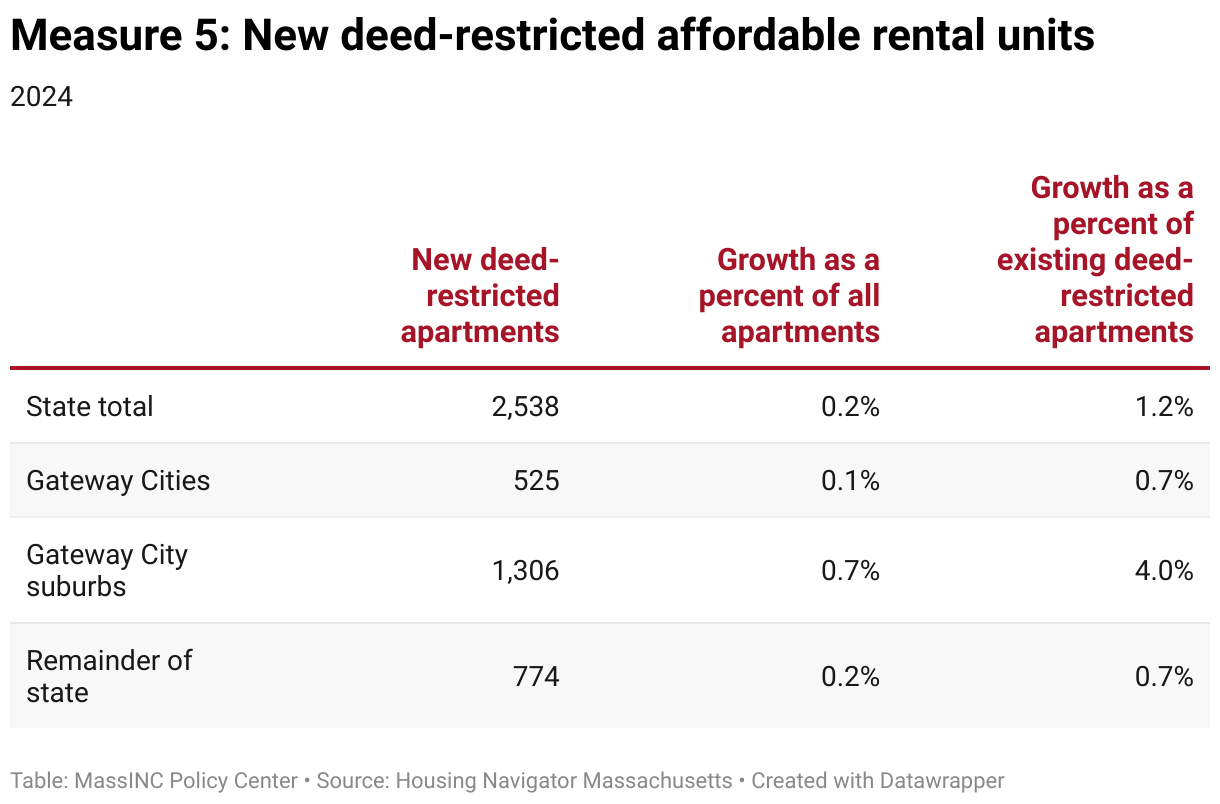
Many suburban towns are stepping up and building affordable housing. Gateway City suburbs produced over 1,300 deed-restricted affordable apartments in 2023, a 4 percent increase in this vital stock. In contrast, Gateway Cities added just 525 deed-restricted apartments, a 0.7 percent increase in their supply of units with long-term affordability provisions.
The sections that follow unpack this chapter’s key findings with greater detail on what each measure captures, why it matters, and how Gateway Cities and their suburbs are performing. Each topic can be expanded by clicking on the dropdowns, where you’ll also find notes about the data sources and methods used. Interactive charts allow you to hover over points for additional detail and share snapshots directly to social media. For those who want to dig deeper, the underlying datasets are available to download and explore. Together, these tools provide both a quick overview and a deeper dive into housing affordability in Gateway Cities.
The Rental Market
Measuring Rent
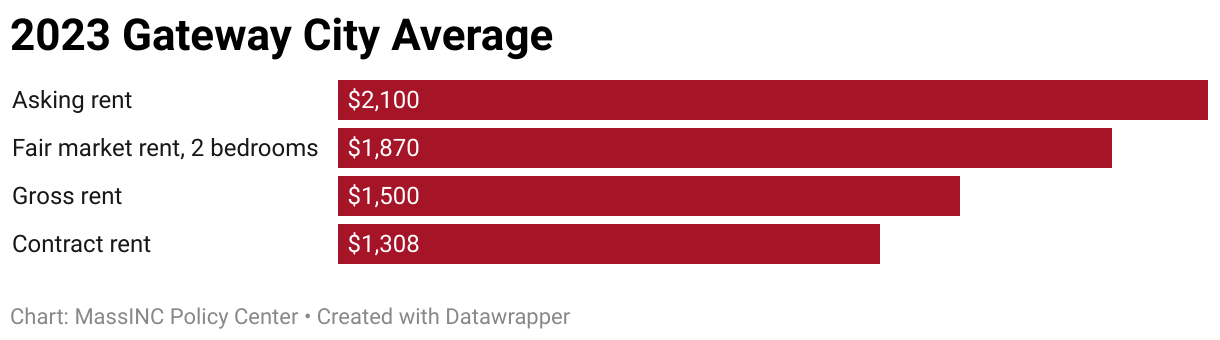
The dollar amount of rent that is reported by available data sources varies greatly, with different estimates being designed to measure different things. In the report, we generally use Zillow’s Observed Rent Index to get the most recent information on how much landlords are requesting for their units and Census Bureau contract rent data to measure the amount current tenants are actually paying.
- Contract rent is the monthly rent agreed to or contracted for, regardless of any furnishings, utilities, fees, meals, or services that may be included. Data are from the American Community Survey (ACS).
- Gross rent is the contract rent plus the estimated average monthly cost of utilities (electricity, gas, and water and sewer) and fuels (oil, coal, kerosene, wood, etc.) if these are paid by the renter (or paid for the renter by someone else). Data are from the ACS.
- Fair Market Rents are estimates of 40th percentile gross rents for standard quality units within a metropolitan area or nonmetropolitan county. Data are from the U.S. Department of Housing and Urban Development.
- The Zillow Observed Rent Index (ZORI) measures changes in asking rents for vacant units available to rent, regardless of the final contracted amount, controlling for changes in the quality of the available rental stock over time. Data are from Zillow Research.
1. Asking Rents
What does this measure?
Asking rents, as measured by the Zillow Observed Rent Index (ZORI), track the list price advertised by landlords, which may differ from the final lease amount. The types of apartments available for rent in a community at any particular moment can change markedly. To reflect actual movements in market prices, ZORI looks at price differences for the same rental units over time.
Why is this important?
Asking rents reveal the prices people encounter in the local market when they are actively searching for an apartment—whether they are renting for the first time, moving for work, or reentering the rental market after selling a home. High asking rents make it harder for young adults to get their own place, more difficult to move for a job, and less appealing for older adults, who might otherwise sell their home and downsize to an apartment.
Notes about the data
Methodological notes about the Zillow Observed Rent Index can be found here: Methodology: Zillow Observed Rent Index (ZORI) – Zillow Research.
How are Gateway Cities doing?
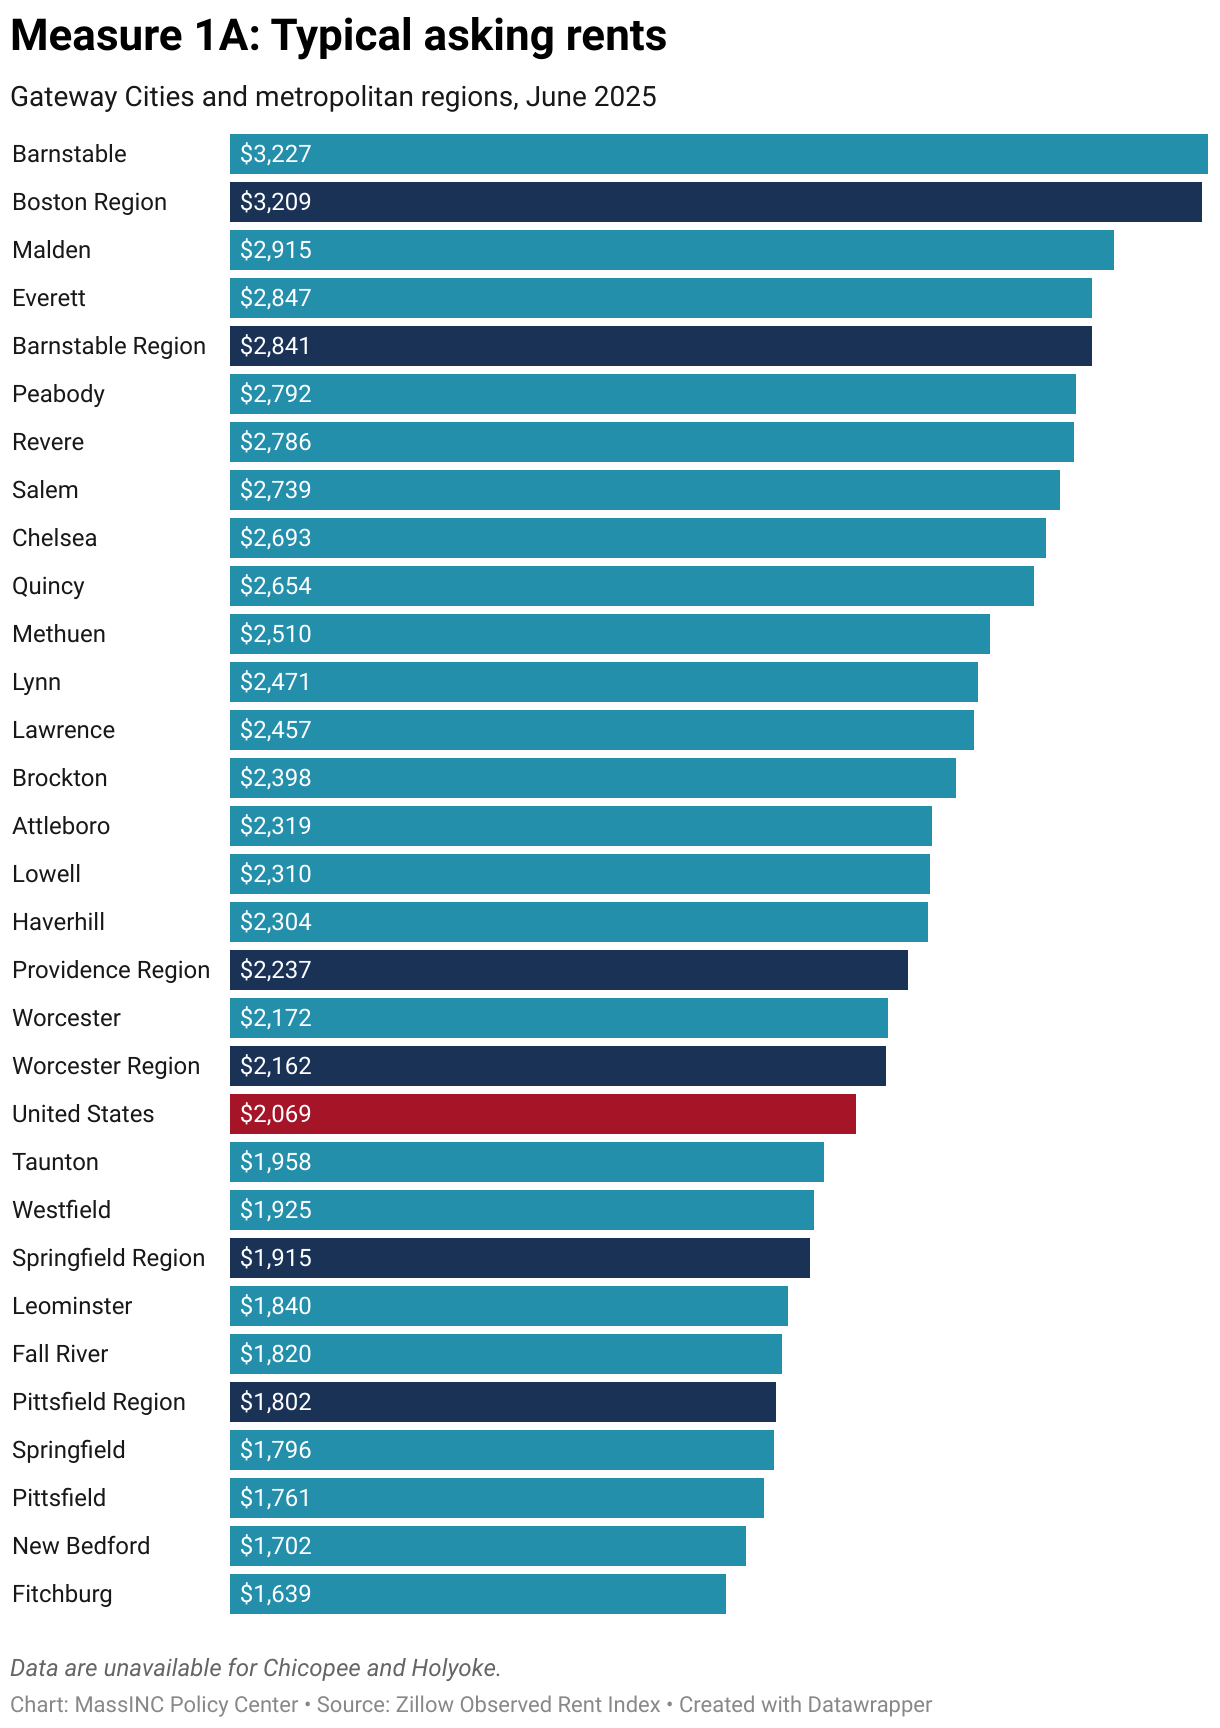
In June 2025, typical asking rents ranged from $1,600 in Fitchburg to $3,227 in Barnstable—a difference of more than 100 percent.
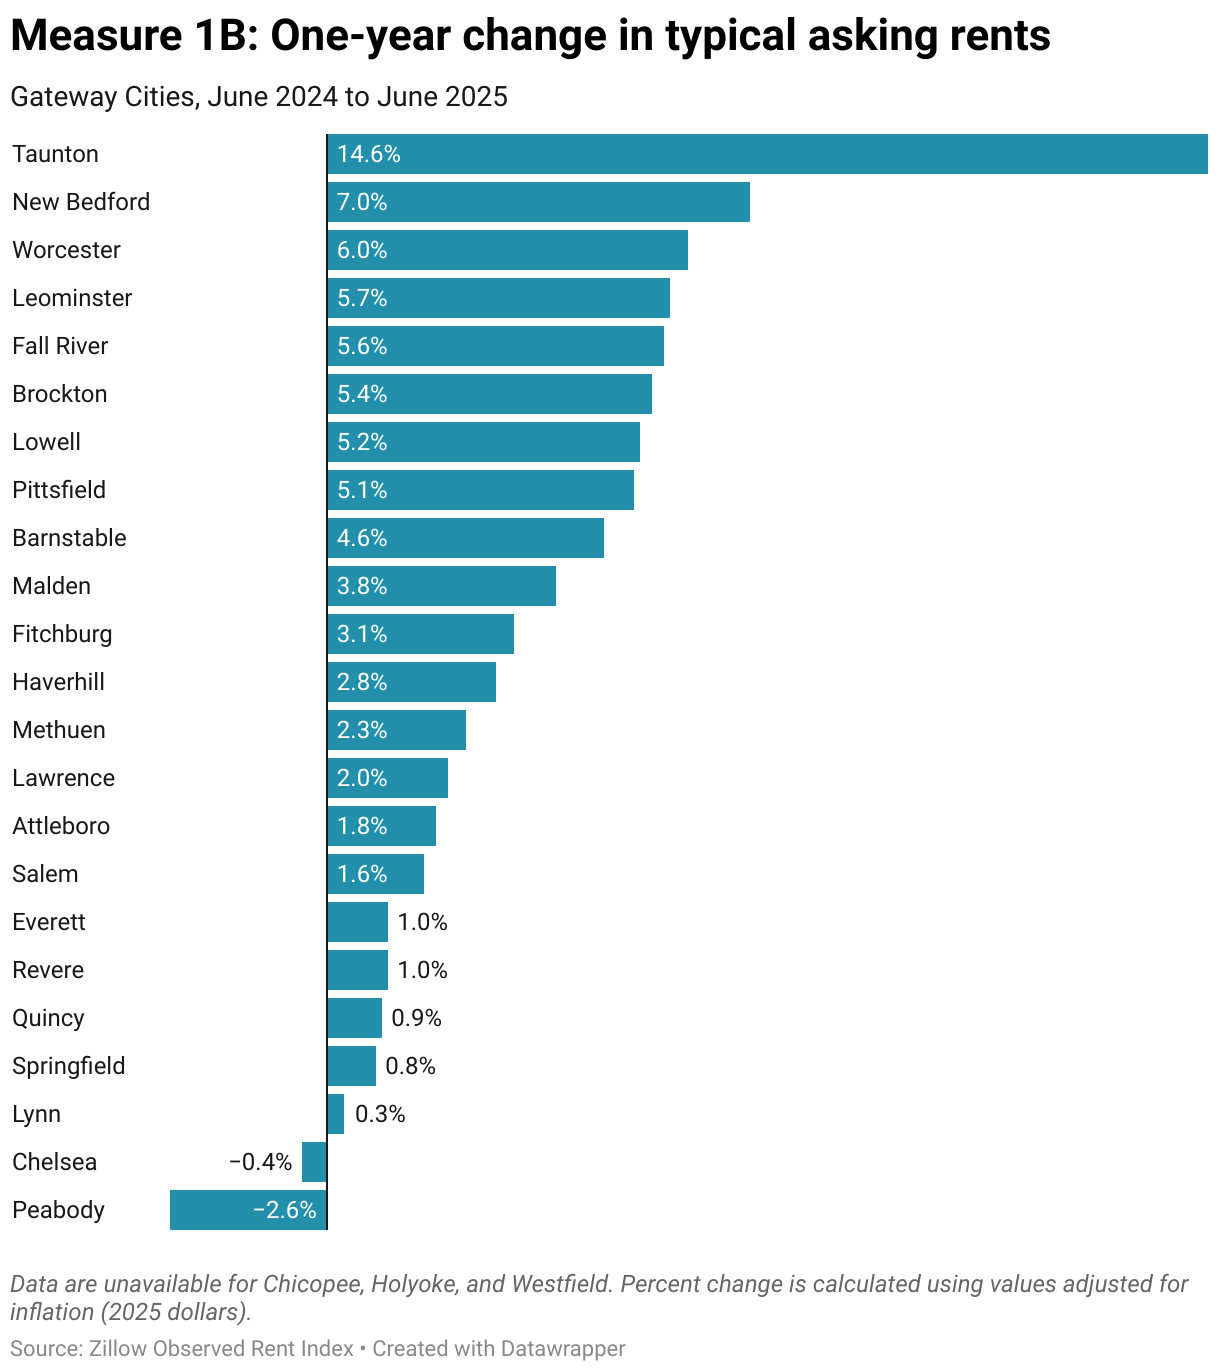
On average, asking rents in Gateway Cities rose 6.6 percent from mid-2024 to mid-2025. This price increase was significantly faster than the 4 percent growth rate over the previous 12-month period. Rents increased at the fastest pace in lower-cost communities such as Taunton and New Bedford over the past year. In many of the high-priced communities close to Boston, such as Peabody and Chelsea, asking rent fell or remained stable.
This geographic pattern meant that the gap between lowest- and highest-cost Gateway Cities narrowed significantly. The difference between the 25th percentile Gateway City and the 75th percentile Gateway City fell from $940 in mid-2024 to $800 in mid-2025.
2. Asking Rent Affordability
What does this measure?
This measure compares the amount of income needed to afford typical asking rents to the actual current median income of renters in these cities. Following convention, rents are affordable when they do not exceed 30 percent of gross income. It is important to note that current asking rents are not the average amount paid by all current tenants in the city. Average rent among all renter households is typically significantly lower because of long-term leases and the fact that landlords will lower asking rents when they find that they have priced a unit too high.
Why is this important?
Housing affordability is not determined by rents alone—it is equally about the amount of income households have to pay them. Comparing asking rents to renter incomes is one indicator of how wide the affordability gap is in Gateway Cities. Asking rent burden also provides a leading measure to gauge how affordability is changing in the marketplace because the data reported by Zillow are much more timely than the data on all renter households that we receive from the ACS.
Notes about the data
Methodological notes about the Zillow Observed Rent Index can be found here: Methodology: Zillow Observed Rent Index (ZORI) – Zillow Research. Wage data are from 2023 ACS estimates and were adjusted upward to account for inflation.
How are Gateway Cities doing?
On average, the median Gateway City renter household earns about $54,000 per year. However, the minimum annual income needed to afford average asking rents in mid-2025 was $94,000 (up from $88,000 in 2024). To comfortably cover what apartments currently cost, the income of the average Gateway City household would need to rise by $40,000. The affordability gap has widened since last year, when it stood at $38,000. The shortfall varies widely across cities, from $20,000 in Leominster—where households must earn at least $73,000 to afford a typical apartment—to $82,000 in Barnstable, where households need $129,000 to cover current asking rents without financial strain.
3. Average Rent Burden
What does this measure?
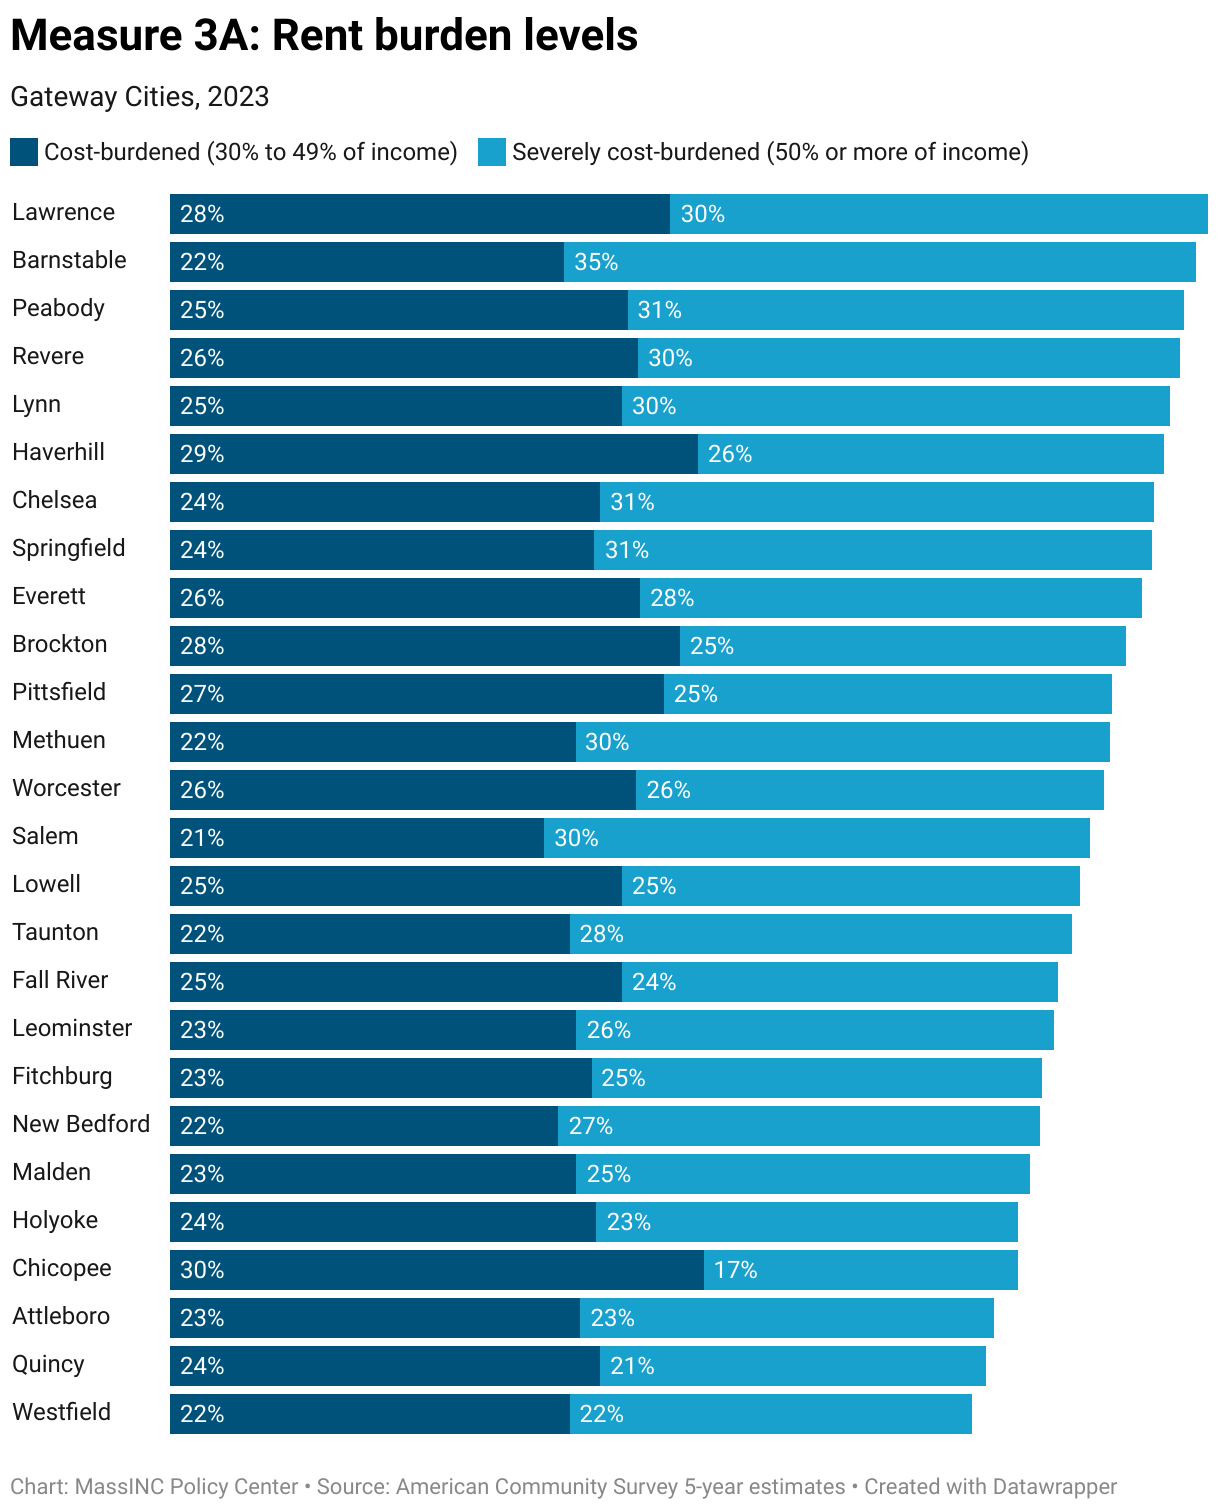
This measure uses ACS data to track the share of renter households that are considered cost-burdened or severely cost-burdened. A household is classified as cost-burdened if its members spend more than 30 percent of their income on rent, and as severely cost-burdened if rent consumes more than 50 percent of income. The estimates are based on five-year ACS averages. Combining years provides greater reliability for smaller geographies like Gateway Cities, but it smooths out short-term changes in rents and incomes.
Why is this important?
This measure captures what renters are actually paying for housing relative to their incomes, rather than what landlords are asking for newly available units. Because it reflects the lived experience of households who may be locked into leases or living in units below current market prices, it provides a more accurate picture of affordability pressures across the entire renter population. While asking rent data offer timely signals about conditions facing new entrants to the market, ACS cost-burden data show how deeply housing costs weigh on current residents’ budgets, and whether families have enough left over for other basic needs.
Notes about the data
The ACS is the source for all cost-burden estimates. Rent burden is calculated using gross rent, which combines the contract rent for which the tenant is personally responsible with estimated average monthly utility costs if paid by the renter. These figures reflect what households actually pay out of pocket. For households with Section 8 Housing Choice Vouchers or similar subsidies, ACS records only the tenant’s portion of the rent, not the total rent paid to the landlord. As a result, the data account for the role of these subsidies in lowering rents below market rates.
How are Gateway Cities doing?
On average, 51 percent of Gateway City renters spent more than 30 percent of their income on rent during the five-year period from 2019 to 2023. This is a slight increase from the previous five-year average, when 50 percent of renters were cost-burdened by this definition, but this difference is within the margin of error. A little more than one-quarter of renters are severely cost-burdened, meaning that rent consumes over 50 percent of their income. The variability in rent burden levels across Gateway Cities is much less extreme than the variability in rent levels themselves because income also varies by region. From 45 percent of renters in Quincy to 58 percent in Methuen, the spread between the least and most cost-burden community is just 13 percentage points.
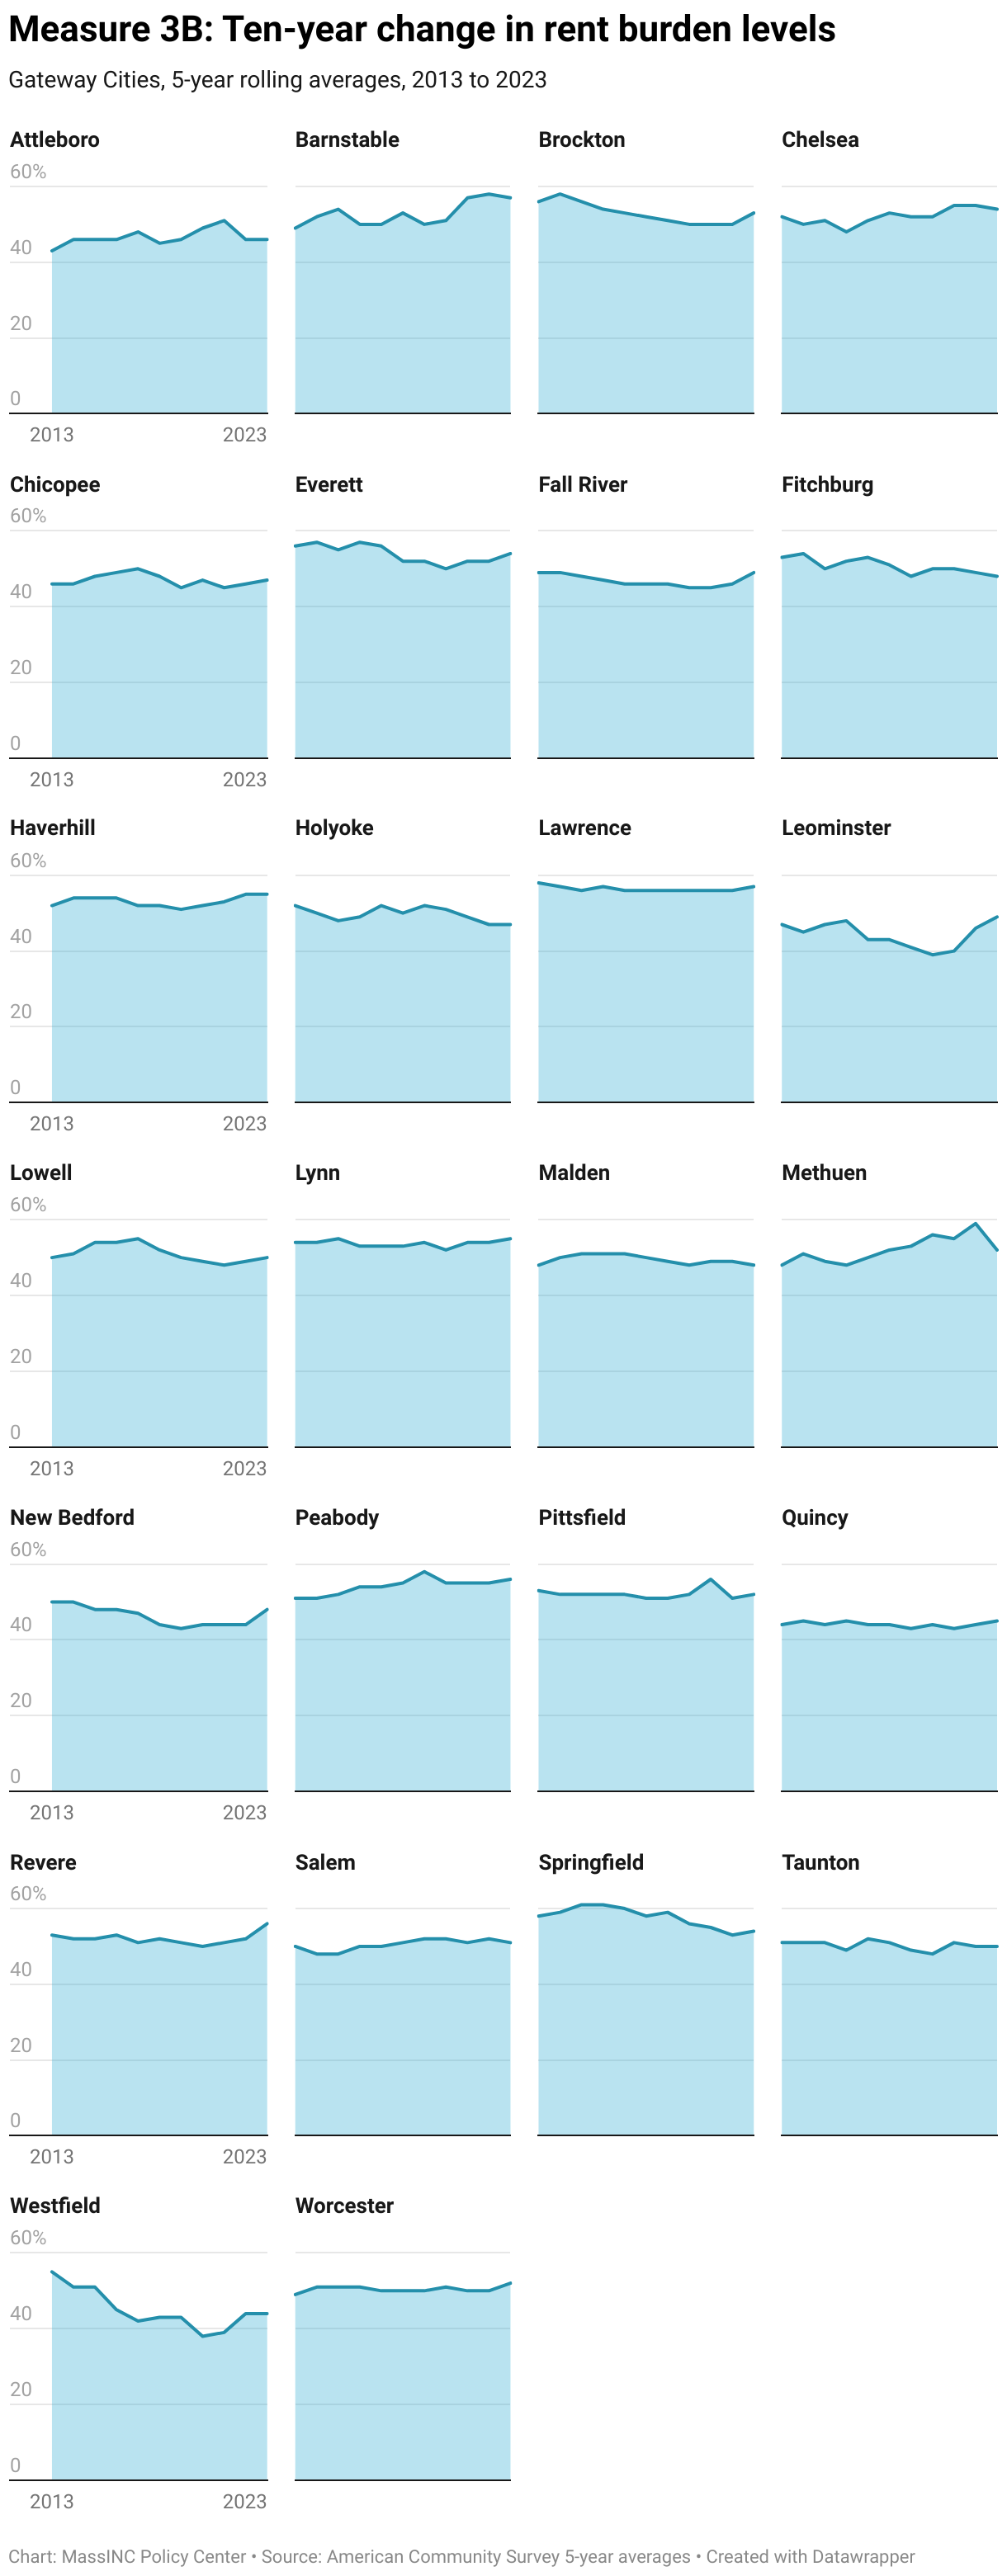
Trends in the data over time suggest that rent burdens in most Gateway Cities have remained relatively flat, with only small shifts in either direction. Because the measure is based on five-year rolling averages, year-to-year changes in rents or incomes are smoothed out, but the data are still useful for detecting longer-term trends. Over the decade from 2012 to 2023, Westfield, Brockton, and Springfield have seen gradual improvement, while Barnstable and Methuen stand out for worsening affordability over time.
4. Deed-Restricted and Naturally Occurring Affordable Rental Housing
What does this measure?
The term “affordable housing” can mean different things depending on the context. The figures above quantify the rental stock of both naturally occurring affordable housing (NOAH) and deed-restricted affordable housing.
NOAH refers to apartments that are affordable to households earning less than 50 percent of the state median income without any subsidy or income restriction. Few data sources attempt to quantify NOAH, yet doing so provides a fuller picture of the affordable housing stock across Massachusetts.
Deed-restricted housing includes apartments reserved for low- and moderate-income households through legally binding use restrictions recorded on the property deed. While often called “subsidized housing,” not all deed-restricted units are produced with government subsidy—for example, some units are created through affordable housing set-asides required by inclusionary zoning ordinances.
Why is this important?
Standard measures of affordable housing often understate the stock available in Gateway Cities because they focus only on deed-restricted apartments. This approach makes sense in Greater Boston, where NOAH is scarce, but it distorts the reality in Gateway Cities, where NOAH has long been the backbone of affordability. By counting both deed-restricted units and NOAH, this measure provides a more balanced view of the housing options available to low- and moderate-income households. As NOAH is depleted, deed-restricted housing plays a growing role in preserving affordability. Equitable development ultimately requires a balanced mix of housing types across all communities. These figures provide a full view of how much affordable housing exists across the Gateway Cities.
Notes about the data
The ACS is the main source of data on NOAH. Contract rent for occupied units and asking rent for vacant units form the basis of our estimates. We then subtract deed-restricted affordable housing and households with mobile housing vouchers from the total number of units with asking rent or contract rent that are affordable for incomes below 50 percent of the state median. To deduplicate households with vouchers that occupy deed-restricted housing units, we assume that 26 percent of tenants of units subsidized with Low-Income Housing Tax Credits are using a mobile housing voucher to help pay their rent based on data from the Massachusetts Executive Office of Housing and Livable Communities and the U.S. Department of Housing and Urban Development. Vouchers were assumed to be distributed proportionally to the location of rental units. Note: Compared to the figures published in the 2024 Housing Monitor, the estimates presented here are significantly lower for the remainder of the state NOAH estimate. This is the result of improvements and corrections to the methodology used.
How are Gateway Cities doing?
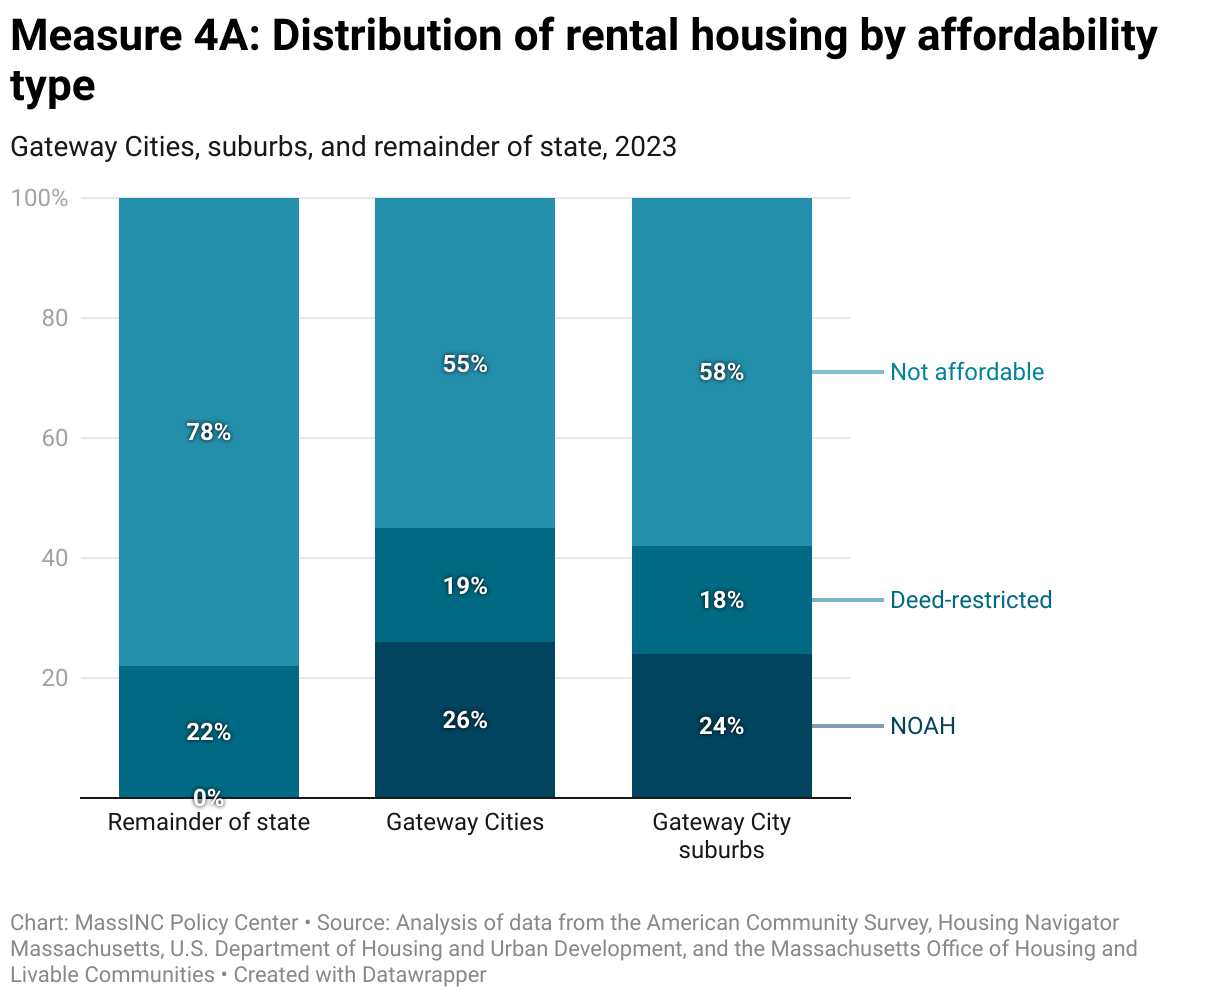
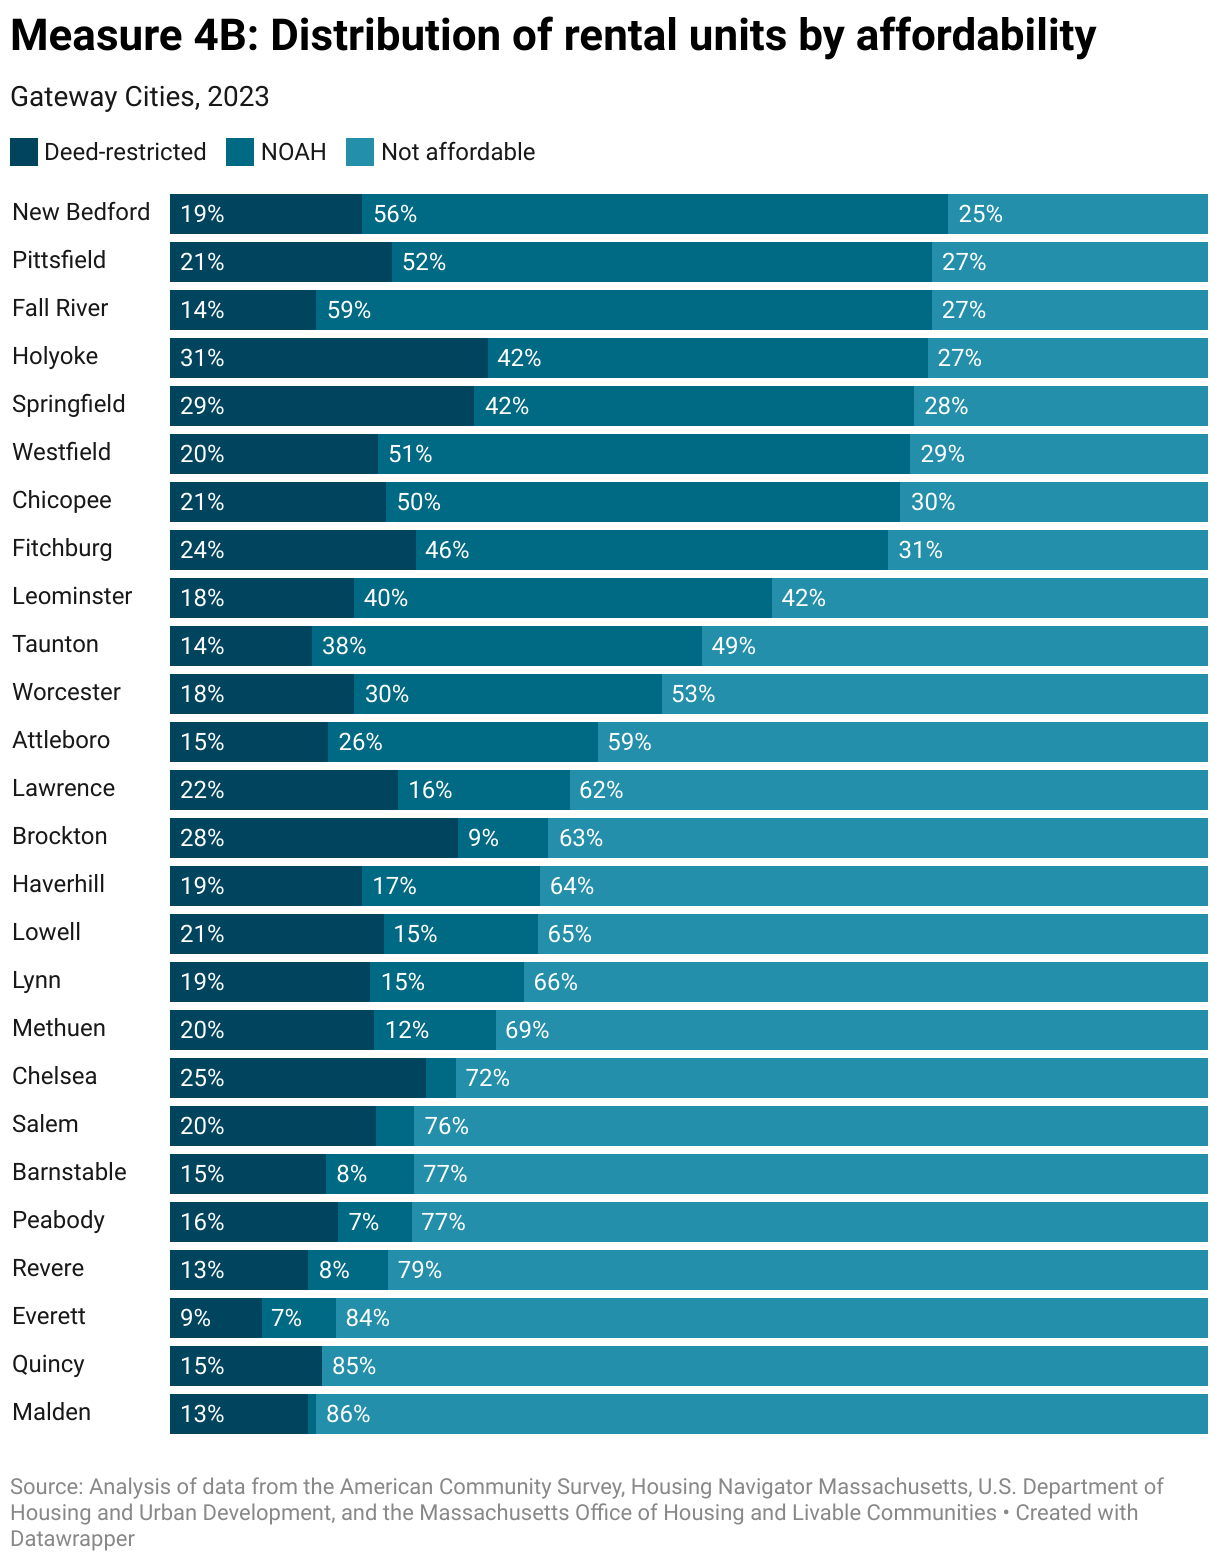
In Gateway Cities, 45 percent of the rental stock is affordable, either naturally or through deed-restrictions requiring units to be offered at rents affordable to income-eligible households. Though suburbs have far fewer rental opportunities in general, likewise about 42 percent of rental units in Gateway City suburbs are affordable. This stands in contrast to the remainder of the state—which includes Greater Boston and some rural areas—where only 23 percent of the rental stock is affordable. This difference is largely driven by the fact that in Greater Boston, there is little to no naturally occurring affordable rental housing.
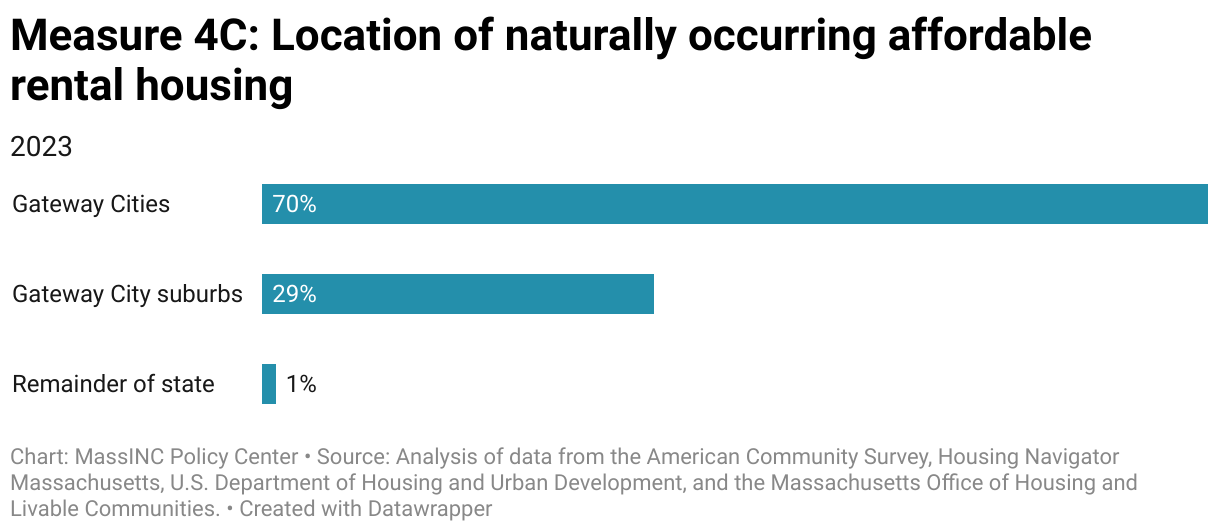
In total, there are 147,000 NOAH apartments across the state; Gateway Cities contain 70 percent of these units. NOAH makes up half or more of all apartments in Chicopee, Westfield, Pittsfield, New Bedford, and Fall River. This affordable stock is vulnerable to market forces. Rent increases can lead to large reductions in the affordable housing stock in these communities. For Gateway Cities near Boston, such as Malden and Quincy, there is virtually no NOAH remaining.
5. Change in the Deed-Restricted Affordable Housing Stock
What does this measure?
Data collected by Housing Navigator Massachusetts provide detailed information on the supply of deed-restricted affordable rental housing across the state. As part of its update process, Housing Navigator also collects data on how much deed-restricted rental housing each community produces on an annual basis.
Why is this important?
Tracking changes in the stock of deed-restricted affordable housing is essential because these units provide the most durable guarantee of long-term affordability. Unlike NOAH, which can disappear quickly as markets shift, deed restrictions ensure that apartments remain accessible to low- and moderate-income households for decades. These data reveal the extent to which all communities are contributing their fair share of permanently affordable housing, a critical factor in addressing residential segregation by income and ensuring that families of different means have genuine options for where to live.
Notes about the data
Housing Navigator Massachusetts first began publishing this data in 2024. More information about tits methodology can be found here: https://housingnavigatorma.org/wp-content/uploads/2025/02/2501-Our-Data.pdf
How are Gateway Cities doing?
Gateway Cities remain the backbone of affordability, with more than 75,000 deed-restricted units—twice as many as their suburbs—and an even larger share of deed-restricted family-sized apartments and units without age-restrictions. In 2023, the 26 Gateway Cities produced 525 new deed-restricted apartments, a 0.7 percent increase in supply.
Gateway City suburbs, long criticized for having fewer apartments relative to their share of households, are stepping up. They contributed more than half (51 percent) of all new deed-restricted apartments in Massachusetts in 2023, growing this affordable rental stock by 4 percent, though from a much smaller base of 33,000 units.
The For-Sale Market
6. Home Values
What does this measure?
The Zillow Home Value Index measures changes in typical home value for homes in the 35th to 65th percentile range. These monthly figures provide another real-time indicator of how residential real estate prices are changing in different communities across the state.
Why is this important?
Tracking typical home values reveals how affordable—or unaffordable—it is becoming for households to enter the housing market. In Massachusetts, where prices have risen steeply, changes in home values directly affect whether moderate-income families can realistically pursue homeownership or are locked into the rental market. At the same time, persistent gaps in values between Gateway Cities and their suburbs reflect long legacies of disinvestment and redlining. Monitoring these differences highlights not only where affordability pressures are most acute, but also whether communities historically left behind are catching up—or falling further behind—in today’s housing market.
Notes about the data
Methodological notes about the Zillow Home Value Index can be found here: Zillow Home Value Index Methodology, 2023 Revision: What’s Changed? – Zillow Research
How are Gateway Cities doing?
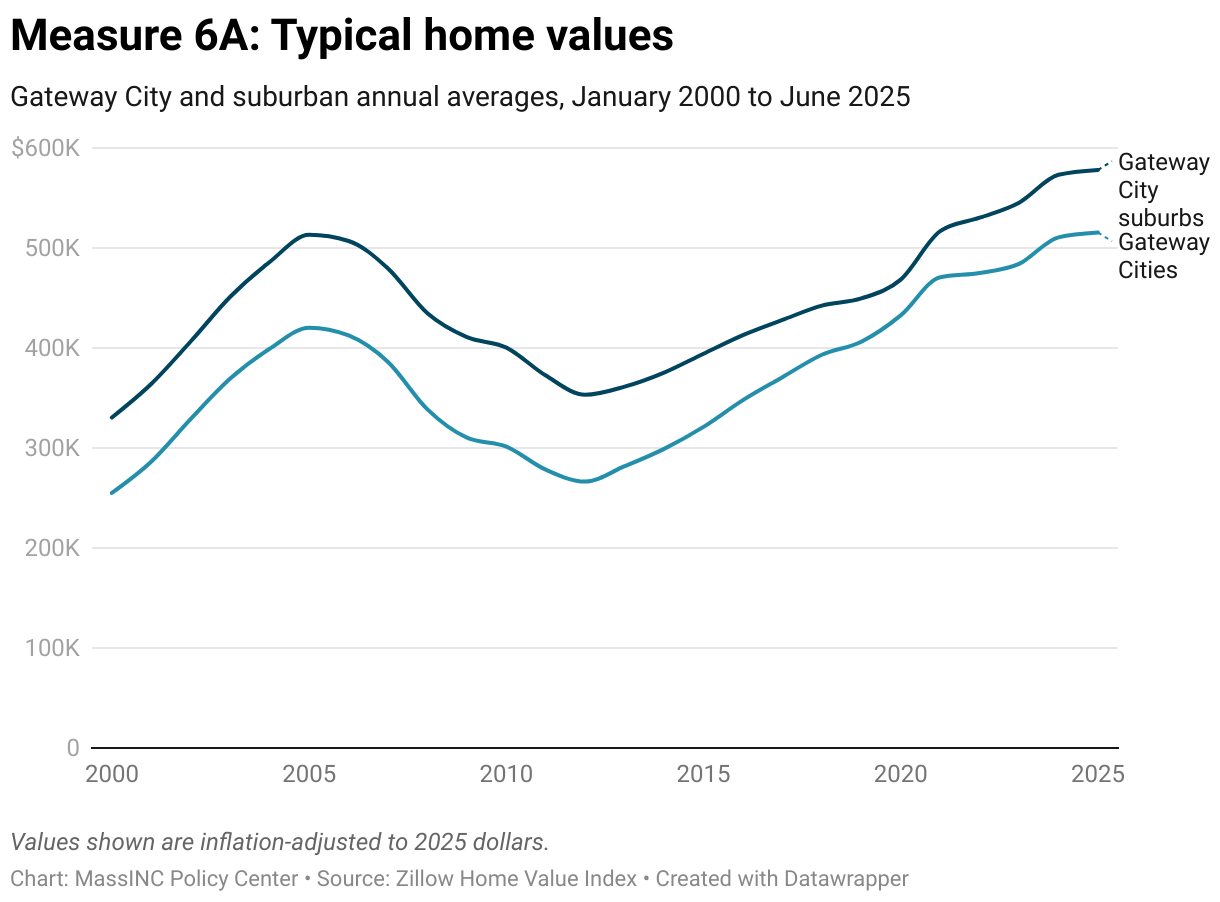
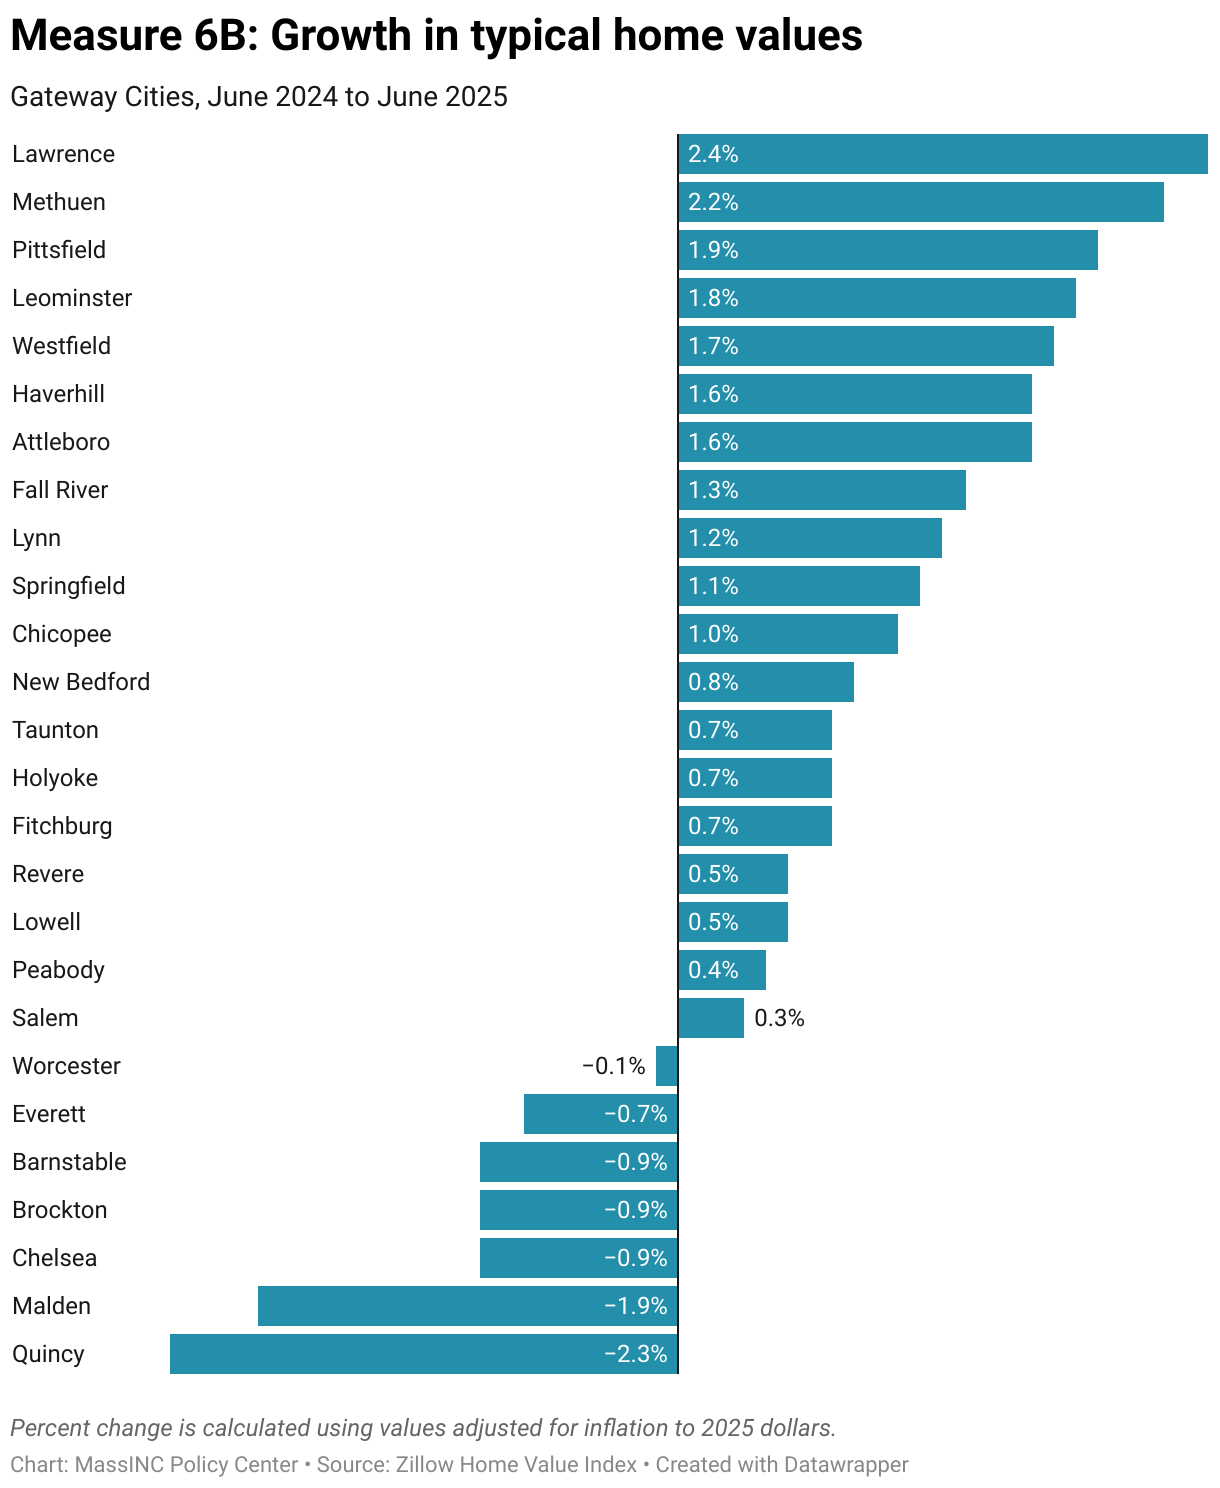
Growth in home values slowed between 2024 and 2025, though values remain at historic highs. In June 2025, the average home in Gateway Cities was valued at $515,000—23 percent higher than the peak of the housing bubble in 2005, when prices averaged $420,000 (all figures are inflation-adjusted to 2025 dollars). After a decade of steady increases averaging 5 percent annually in Gateway Cities and 4 percent in their suburbs, real price growth has cooled to less than 1 percent over the past year. In nominal terms, however, prices still rose by about 3 percent, showing that values continued climbing even as inflation eroded much of the gain. The recent slowdown may be linked to an uptick in active listings, which surged in mid-2025.
Within Gateway Cities, Lawrence and Methuen saw the fastest increases, with prices rising more than 2 percent between mid-2024 and mid-2025. By contrast, the most expensive markets grew more slowly or even declined. In Malden and Quincy, where average home values exceed $680,000, prices fell by roughly 2 percent over the past year.
7. For-Sale Affordability
What does this measure?
This indicator estimates the share of households in each Gateway City that can afford to buy a home in their community. It combines Zillow’s measure of typical home values with ACS income distributions to calculate the share of households that is able to carry a new mortgage at current prices and interest rates.
Why is this important?
Measuring the share of households that can afford to buy in their own city shows whether local housing markets provide realistic pathways to homeownership. Because owning a home can stabilize housing costs and support long-term residency, this measure helps assess whether residents can remain in their community and build wealth as prices rise.
Notes about the data
Affordability is modeled using a 30-year fixed-rate mortgage with a 3 percent down payment at the prevailing 2025 interest rate of 6.69 percent. Monthly costs include principal and interest, property taxes based on city-specific 2025 rates, and homeowner’s insurance premiums equal to 0.3 percent of home value; private mortgage insurance is excluded. Because incomes are measured from 2023 ACS 5-year estimates adjusted for inflation to 2025 dollars, they may not fully capture recent changes in income. Results are benchmarked against Zillow’s measure of typical home values, meaning that they reflect the financial feasibility of buying a representative home rather than the number or type of homes actually for sale at affordable amounts. Methodological notes about the Zillow Home Value Index can be found here: Zillow Home Value Index Methodology, 2023 Revision: What’s Changed? – Zillow Research
How are Gateway Cities doing?
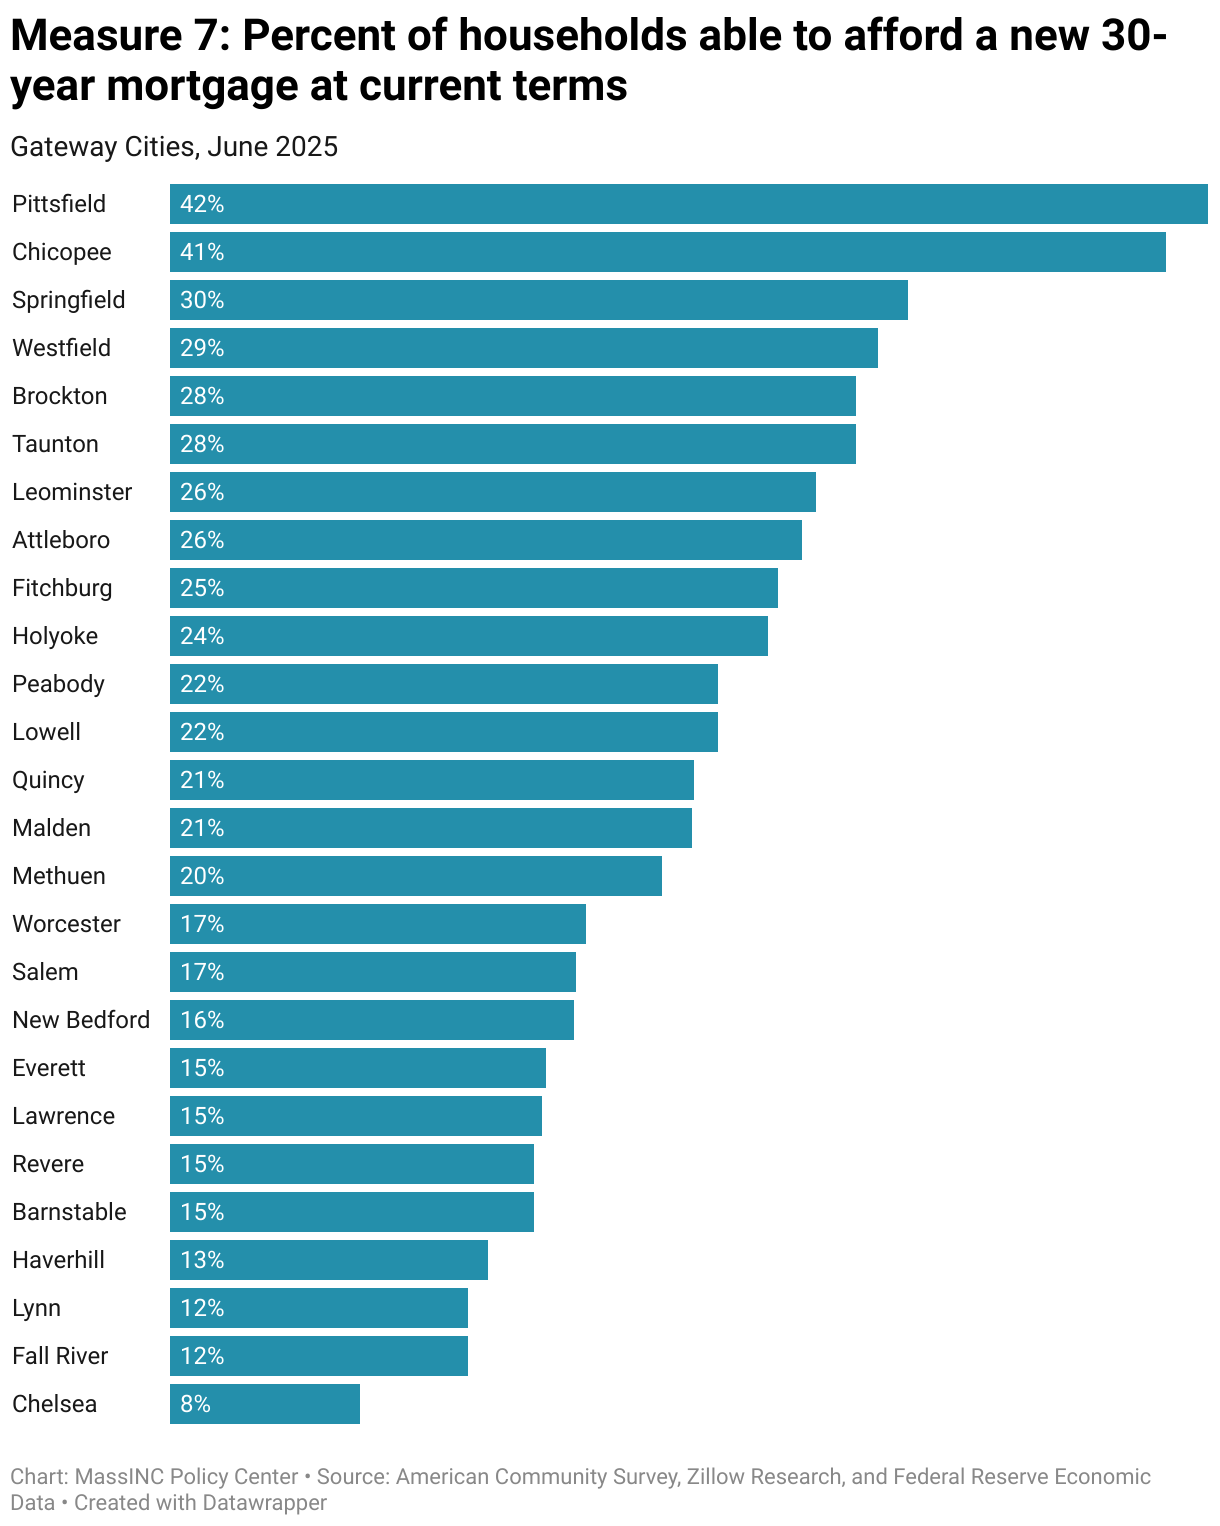
Rising home values have put homeownership increasingly out of reach for Gateway City residents. On average, just 20 percent of these households can afford the typical home in 2025—far fewer than the 65 percent of households across Massachusetts who own homes. Affordability varies widely across the state; in Pittsfield and Chicopee, more than 40 percent of households can still afford the median-priced home, while in Chelsea the share is just 8 percent.
8. Deed-Restricted Affordable For-Sale Housing
What does this measure?
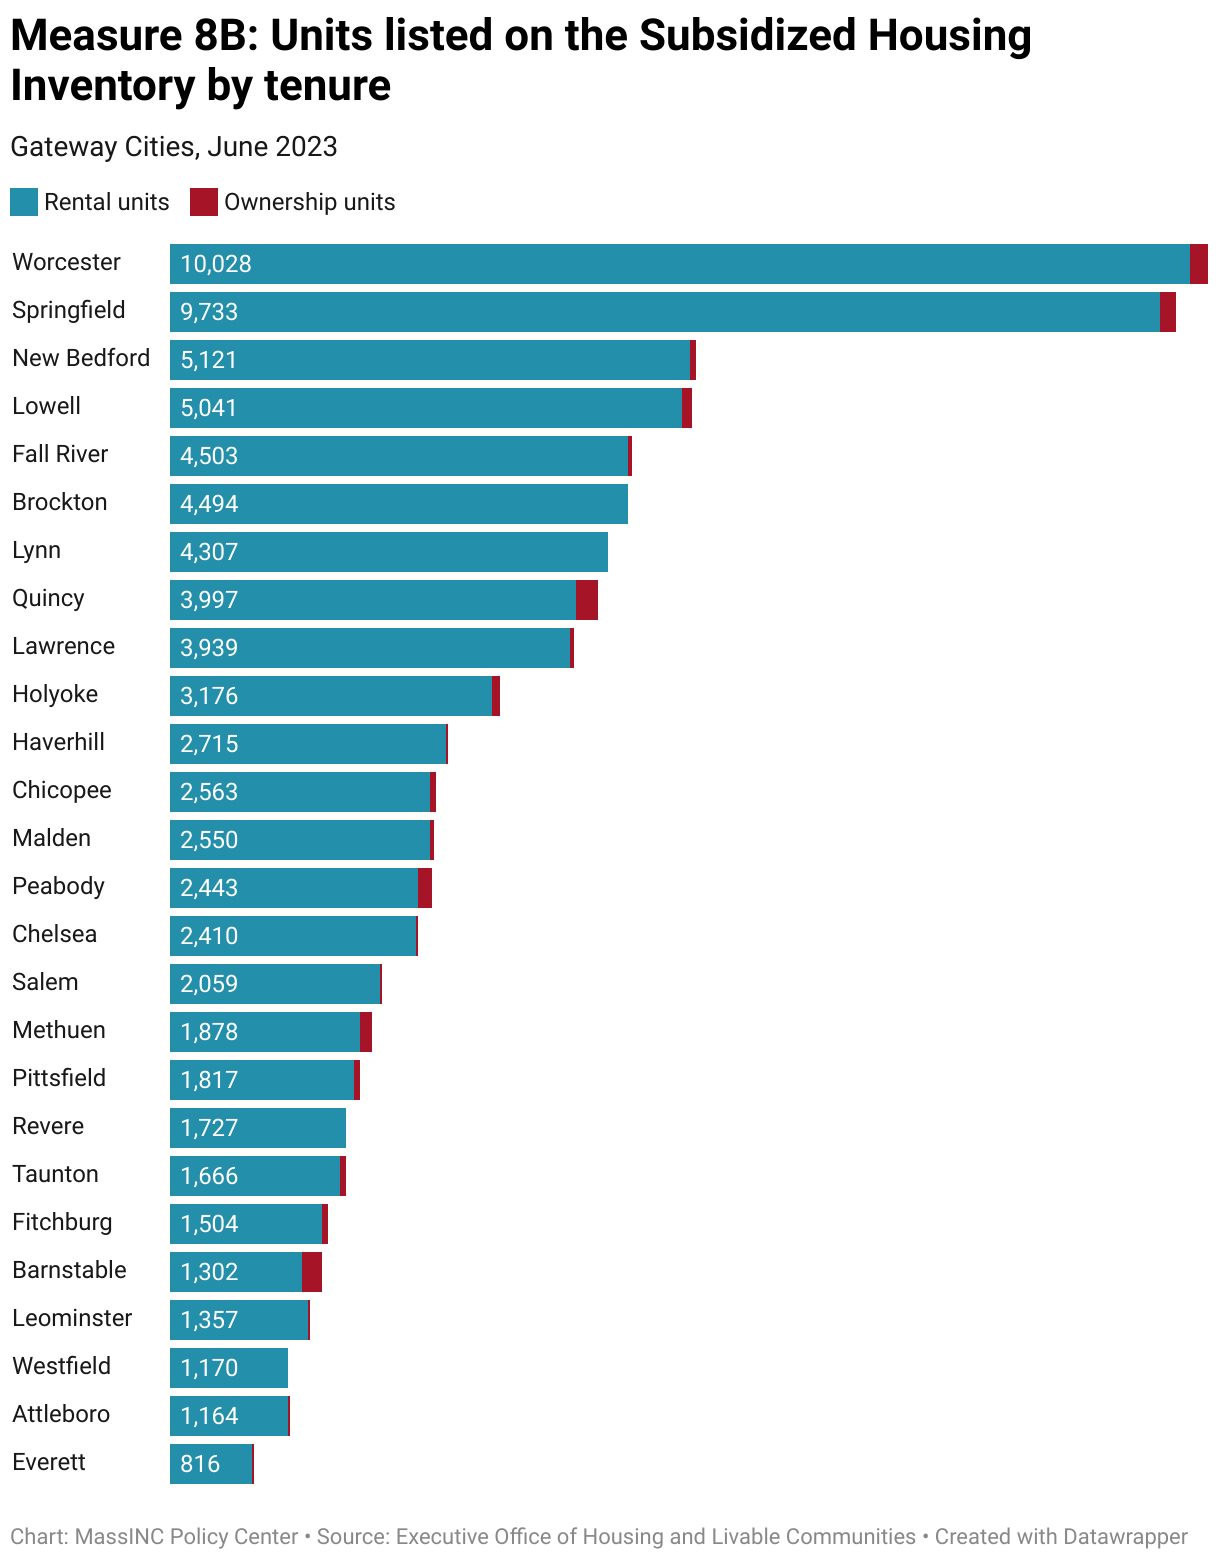
This measure draws on Massachusetts’ Subsidized Housing Inventory (SHI), the official list used to track compliance with Chapter 40B’s requirement that at least 10 percent of a community’s housing stock be affordable to low- and moderate-income households. The SHI includes both rental and ownership units that meet state affordability criteria, though deed-restricted affordable ownership units are relatively rare. Because entire developments are added to the SHI if they meet a minimum set-aside—typically 25 percent of units affordable at or below 80 percent of area median income, or 20 percent at or below 50 percent of area median income—not every unit listed is actually affordable. At the same time, not all affordable units have been added to the SHI, making it an imperfect but still valuable source of information on affordable homeownership.
Why is this important?
Producing affordable homeownership units opens doors for lower-income households to buy into their own communities—an especially important intervention in Gateway Cities, where ownership may look attainable on paper but remains out of reach for many residents with modest incomes. These homes provide residents with a foothold in the housing market, offering stability and a pathway into the middle class. They can also help balance the tenure mix in rental-heavy neighborhoods, strengthening communities and reducing displacement pressures. And even as deed restrictions expire at different rates, the public investment can leave a lasting imprint when they create ownership opportunities where they would not otherwise exist.
Notes about the data
The SHI is only required to be updated every two years, and data for 2025 are not yet available. For this reason, the figures reported above are the same data presented in the 2024 Housing Monitor. More information about the SHI inclusion criteria and update process can be found here: https://www.mass.gov/doc/guidelines-gl-c40b-comprehensive-permit-projects-and-subsidized-housing-inventory/download
How are Gateway Cities doing?
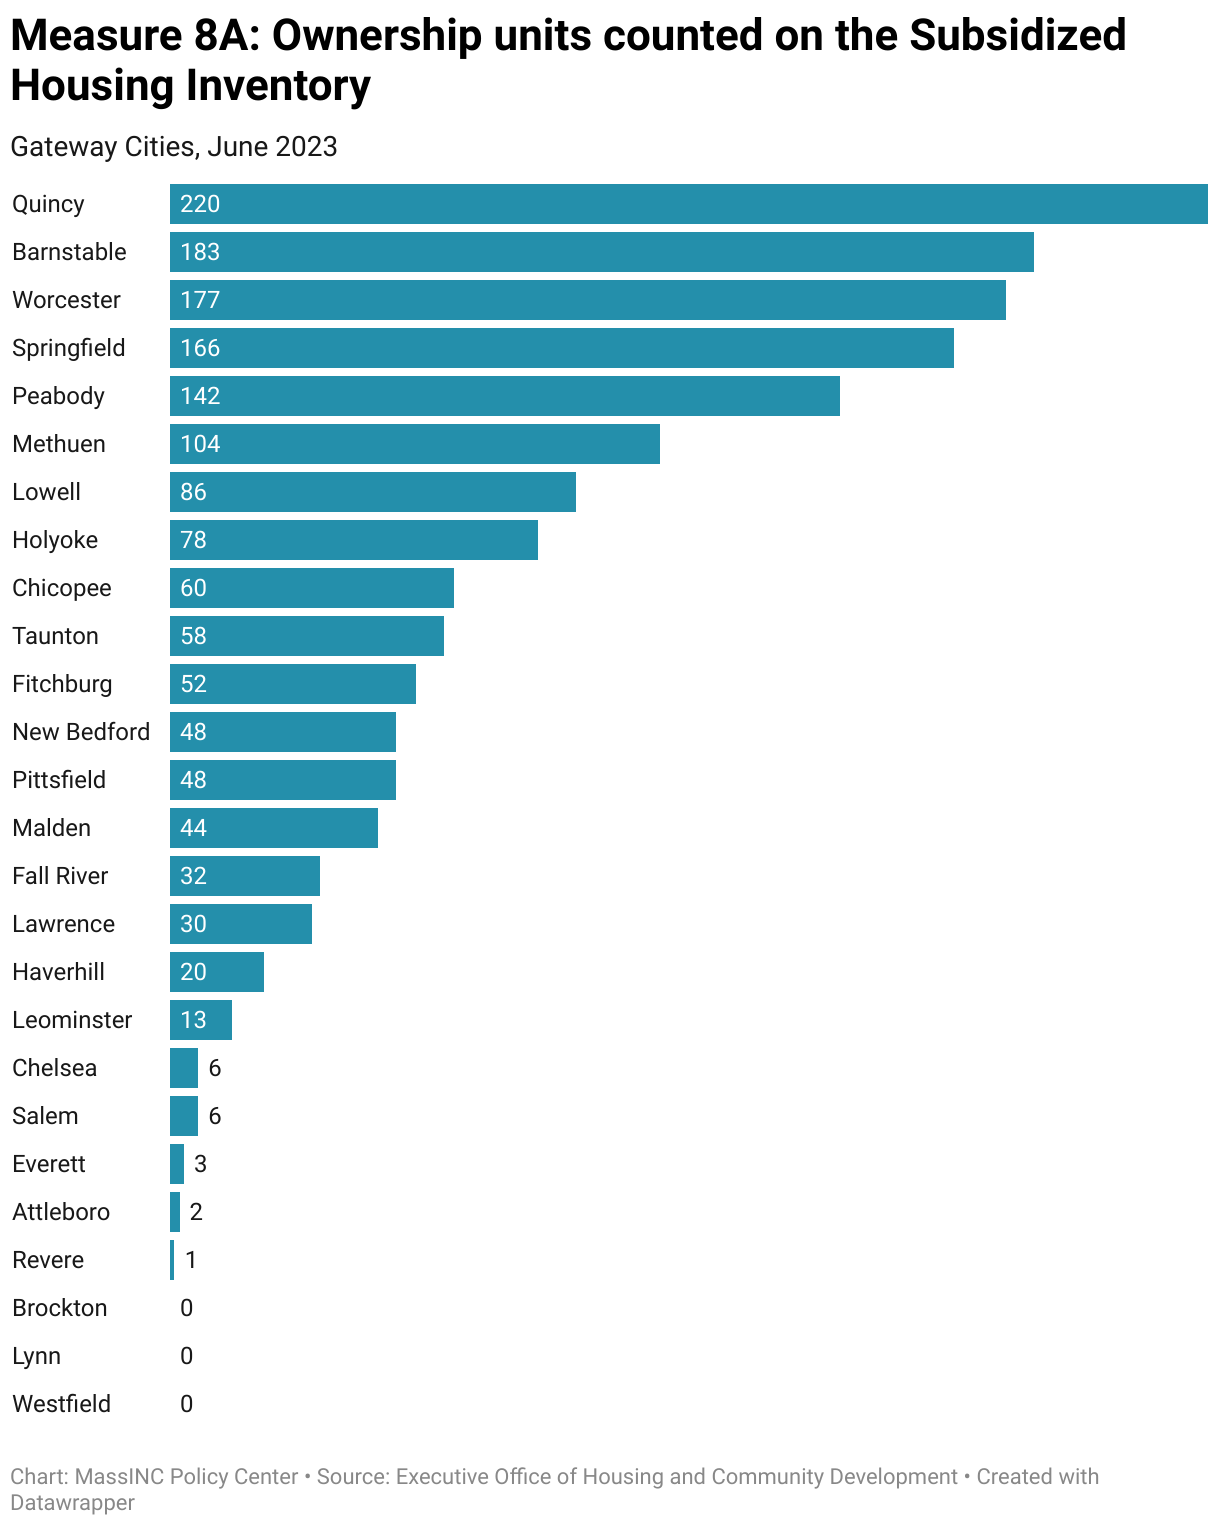
Among Gateway Cities, the number of ownership units on the SHI ranges from 220 in Quincy to zero in Brockton, Lynn, and Westfield. Ownership units are a small fraction of the overall affordable stock as listed on the SHI, accounting for just 1.9 percent of all units on the SHI in Gateway. In Barnstable, ownership units contribute the most toward meeting the 10-percent SHI threshold, with ownership units on the SHI accounting for 0.8 percent of all year-round units.
2025 Gateway Cities Housing Monitor
Chapters

2025 Gateway Cities Housing Monitor
September 17, 2025