
Does earning a “good income” provide access to the middle-class lifestyle of generations past in Massachusetts today?
While this question is hotly debated, comprehensive data to examine it carefully are not readily available. Component 1 of the Middle Class Status Report attempts to fill a key information gap by measuring what it actually costs to achieve and sustain a middle-class standard of living. By building a household budget that includes childcare, health insurance, higher education, housing, savings, taxes, and other common financial obligations, the analysis shows that the income required to be middle class in Massachusetts has outpaced inflation in recent years—particularly for young families raising children.
Introduction
Many Massachusetts families who appear comfortably middle class by education and occupation consistently report finding themselves struggling to keep up with the costs associated with an ordinary middle-class life. This concern surfaces a basic question: What does it actually cost to be middle class in Massachusetts today?
Component 1 of the Middle Class Status Report combines data from various sources to help answer this question. In contrast to more typical cost-of-living budgets that estimate minimum financial resource requirements, we attempt to estimate what it costs to achieve and maintain the hallmarks of the American Dream. Our middle-class budget includes items that most cost-of-living budgets leave out, like retirement savings, higher education, and modest leisure activities. By estimating a comprehensive middle-class budget for each age group and household type, we can see much more clearly:
- What it takes to afford a true middle-class standard of living;
- How the cost has changed over time; and
- Where Massachusetts stands relative to other states.
Like all economic models, our approach includes simplifications and limitations. Still, we believe this method (detailed in the Appendix) offers a reliable benchmark for tracking the health of the middle class, especially when paired with the income, work effort, and other metrics presented in subsequent chapters.
Benchmark Households
To model the cost to be middle class in a way that reflects how real families live, we use a set of benchmark households that vary both by family structure and stage of life. Because including every possible combination of household structure and age would create hundreds of categories and insurmountable data challenges, we focus on five common family types:
- Single adult
- Couple without children
- Single parent with two children
- Two adult, two-child household (single earner)
- Two adult, two-child household (dual earners)
Two-parent, single-earner households are defined as households with two adults and two children with only one adult currently employed. For purposes of the budget model, we assume that the non-working adult provides unpaid childcare, and therefore no childcare expenses are included in the budget estimate for this group.
We subset these family types into five life stage groups: ages 26 to 34, 35 to 44, 45 to 54, 55 to 64, and 65 and older. These groupings allow us to model how expenses shift as households move through transitions, such as leaving parental health insurance, paying for childcare, sending children to college, preparing for retirement, or entering Medicare.
To be sure, the timing and duration of these events vary widely across households. However, for these prototypical households, we believe the data that we have collected approximate actual costs and their movement over time fairly well.
For more information about the middle class cost model, please refer to the full methods documentation.
1. The Middle Class Budget in Massachusetts
The minimum income required to sustain a middle-class standard of living in Massachusetts varies substantially by household type and life stage. Drawing on data for 2024 (the most recent year available from most sources), our rough approximations suggest a single adult requires an annual income of at least $82,000 in their late twenties and early thirties, rising to just over $91,000 in midlife before declining to $62,000 after age 65. Two-adult households without children must have an income between $118,000 and $134,000 during their working years and just under $100,0000 annually in retirement to afford a middle-class lifestyle.

For households with two children, required income is substantially higher and follows a different age trajectory. During the early childhood years (ages 26 to 34), required income ranges from roughly $142,000 for a two-adult household with one earner to $213,000 for two earners, reflecting the inclusion of childcare costs. Required income declines in the 35 to 44 age range, when children attend public schools. It then rises again for the 45 to 54 cohort, with parents shouldering half the estimated higher-education costs for their children and college students borrowing to cover the other half (following the assumptions of our model). At this expensive stage, required income reaches approximately $173,000 for a single parent and nearly $220,000 for households with two adults.

Living with another adult reduces costs on a per-person basis, though not proportionally. For example, a single adult age 26 to 34 requires about $82,000, while two adults in the same age range require $118,000 combined, or roughly $59,000 per person.
Two-adult households with children face significant tradeoffs between childcare expenses and full employment. In the early childhood years, the difference between the one- and two-earner minimum middle-class budget threshold is roughly $70,000. This exceeds the cost of the childcare that dual earners require because higher incomes increase taxes and savings requirements. As a result, the second working parent must generate substantial income before the two-earner structure meaningfully improves the household’s financial position. At the same time, stepping out of the workforce may affect long-term earnings trajectories.
Unlike two-adult households, single-adult households typically cannot substitute unpaid caregiving time for childcare. In the absence of extended family or other informal support, childcare becomes a necessary cost of labor force participation.
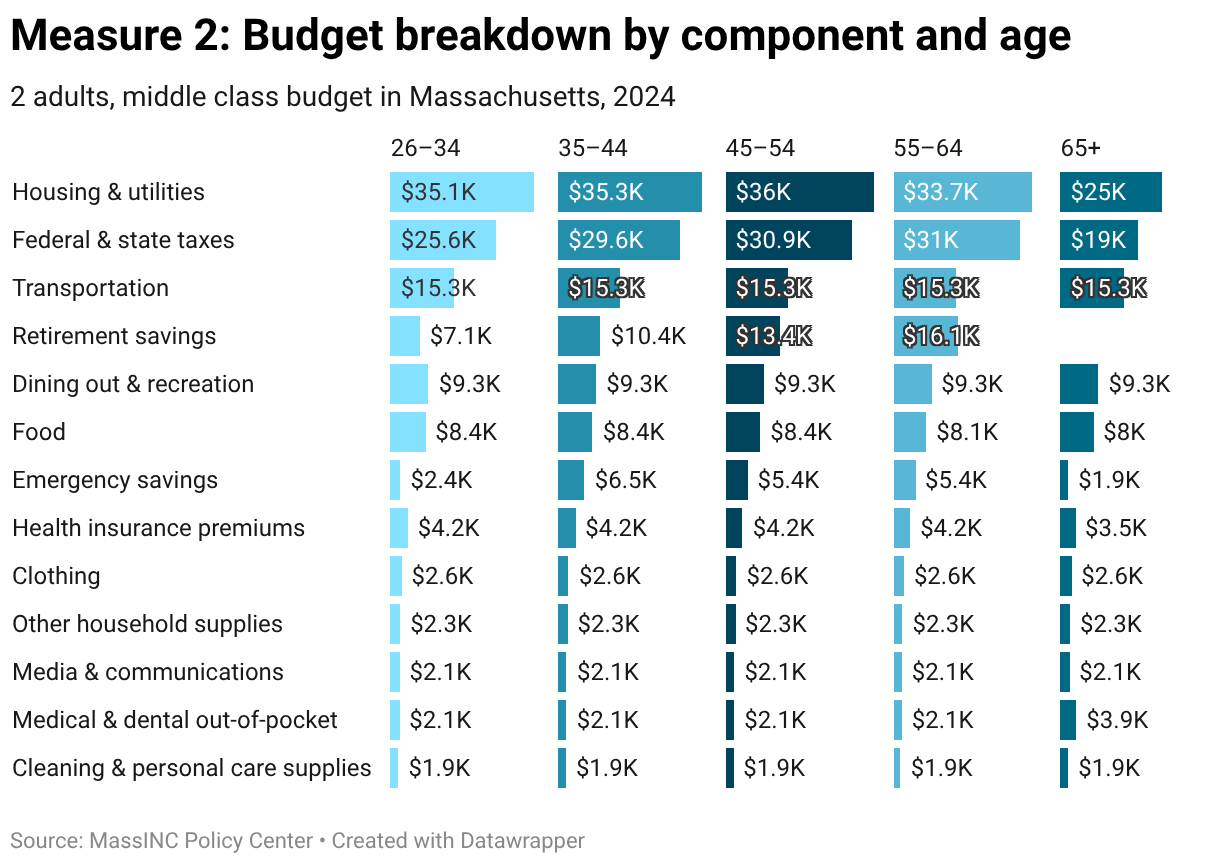
2. The Massachusetts Middle Class Budget by Component
To provide a more complete picture of the costs associated with a middle-class lifestyle in Massachusetts, Measure 2 enumerates each component of the budget estimate. The costs of several items—including taxes, retirement contributions, and student loan repayments—increase with income rather than prices. We first estimate all other components of the budget (which we refer to as fixed costs), then calculate taxes and other variable costs based on the minimum income required to cover those costs.
At the minimum income that gives households the means to afford all fixed costs in the middle-class budget, state and federal taxes are the most expensive category for Massachusetts households with children. For all household types, housing and related expenses are also a top cost center, accounting for approximately 20 to 30 percent of the budget. The data we use to track this category come from the US Census Bureau’s American Community Survey and reflect what households with different family structures actually spend each month, whether they own or rent. These figures are inclusive of property taxes and insurance (for owners) and utility payments (for both owners and renters). Because the estimates reflect actual expenditures, they account for intergenerational transfers. For instance, households who inherited a home or received help with downpayments from family will have lower housing expenditures. This reduces the average cost, understating housing cost burden for households who are not receiving such support.
Childcare plays a particularly large role in shaping the middle-class budget for young parents. We assume the prototypical household with two working parents age 26 to 34 and two children requires full-time childcare for one infant and one toddler. In Massachusetts, this costs roughly $46,000 per year.
Savings also meaningfully influence the income required to maintain a middle-class standard of living. Financial planners commonly recommend that households set aside between 10 and 15 percent of income for retirement. In addition, households are generally advised to maintain emergency savings sufficient to cover several weeks or months of expenses in the event of job loss, medical costs, or other financial shocks. In our model, roughly follow the guidance of financial planners (with employers contributing 5 percent) and emergency savings are treated as a continuous contribution rather than a one-time goal, since households routinely draw on these funds to manage irregular but recurring expenses such as home and vehicle repairs or seasonal childcare needs.
Finally, the model includes student loan repayment as a standard component of middle-class obligations for households in the 26 to 34 cohort, but these costs are understated in 2024. These costs are derived based on the lowest-cost broadly available income-driven repayment plan at a given time. In 2024, however, federal court rulings halted implementation of the Saving on a Valuable Education (SAVE) Plan and led the U.S. Department of Education to place affected borrowers into administrative forbearance. While payments were required for part of the year, they were suspended for the remainder, and for simplicity the model treats 2024 as a zero-payment year. Moving forward, SAVE remains unavailable to new borrowers, so we expect the middle-class budget threshold for younger households to rise disproportionately.


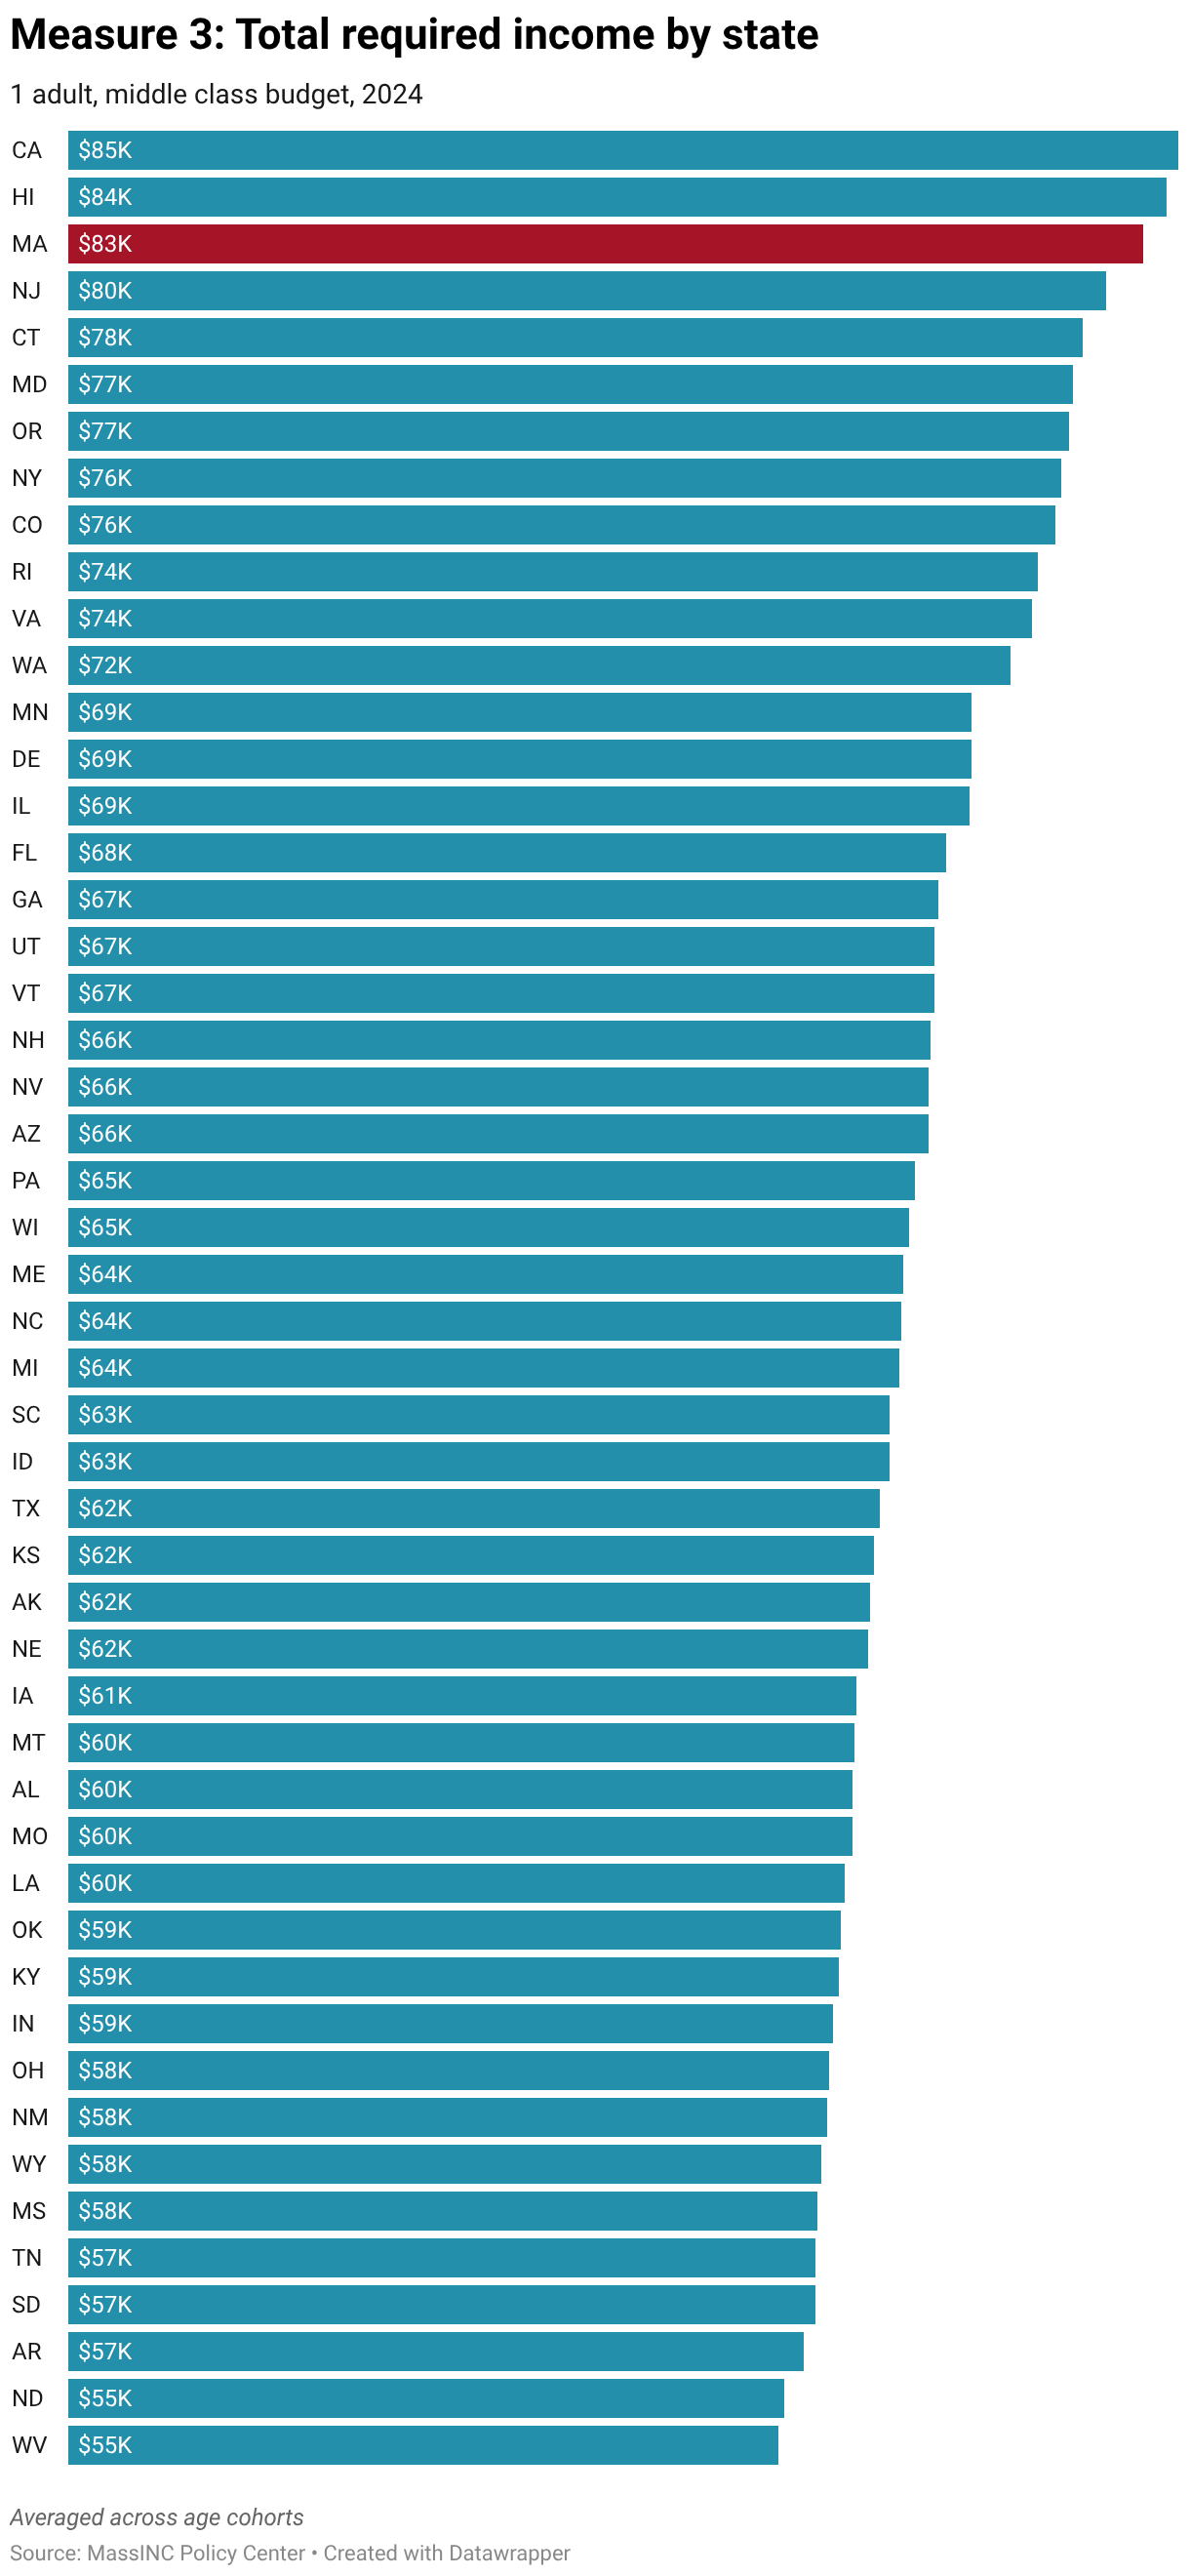
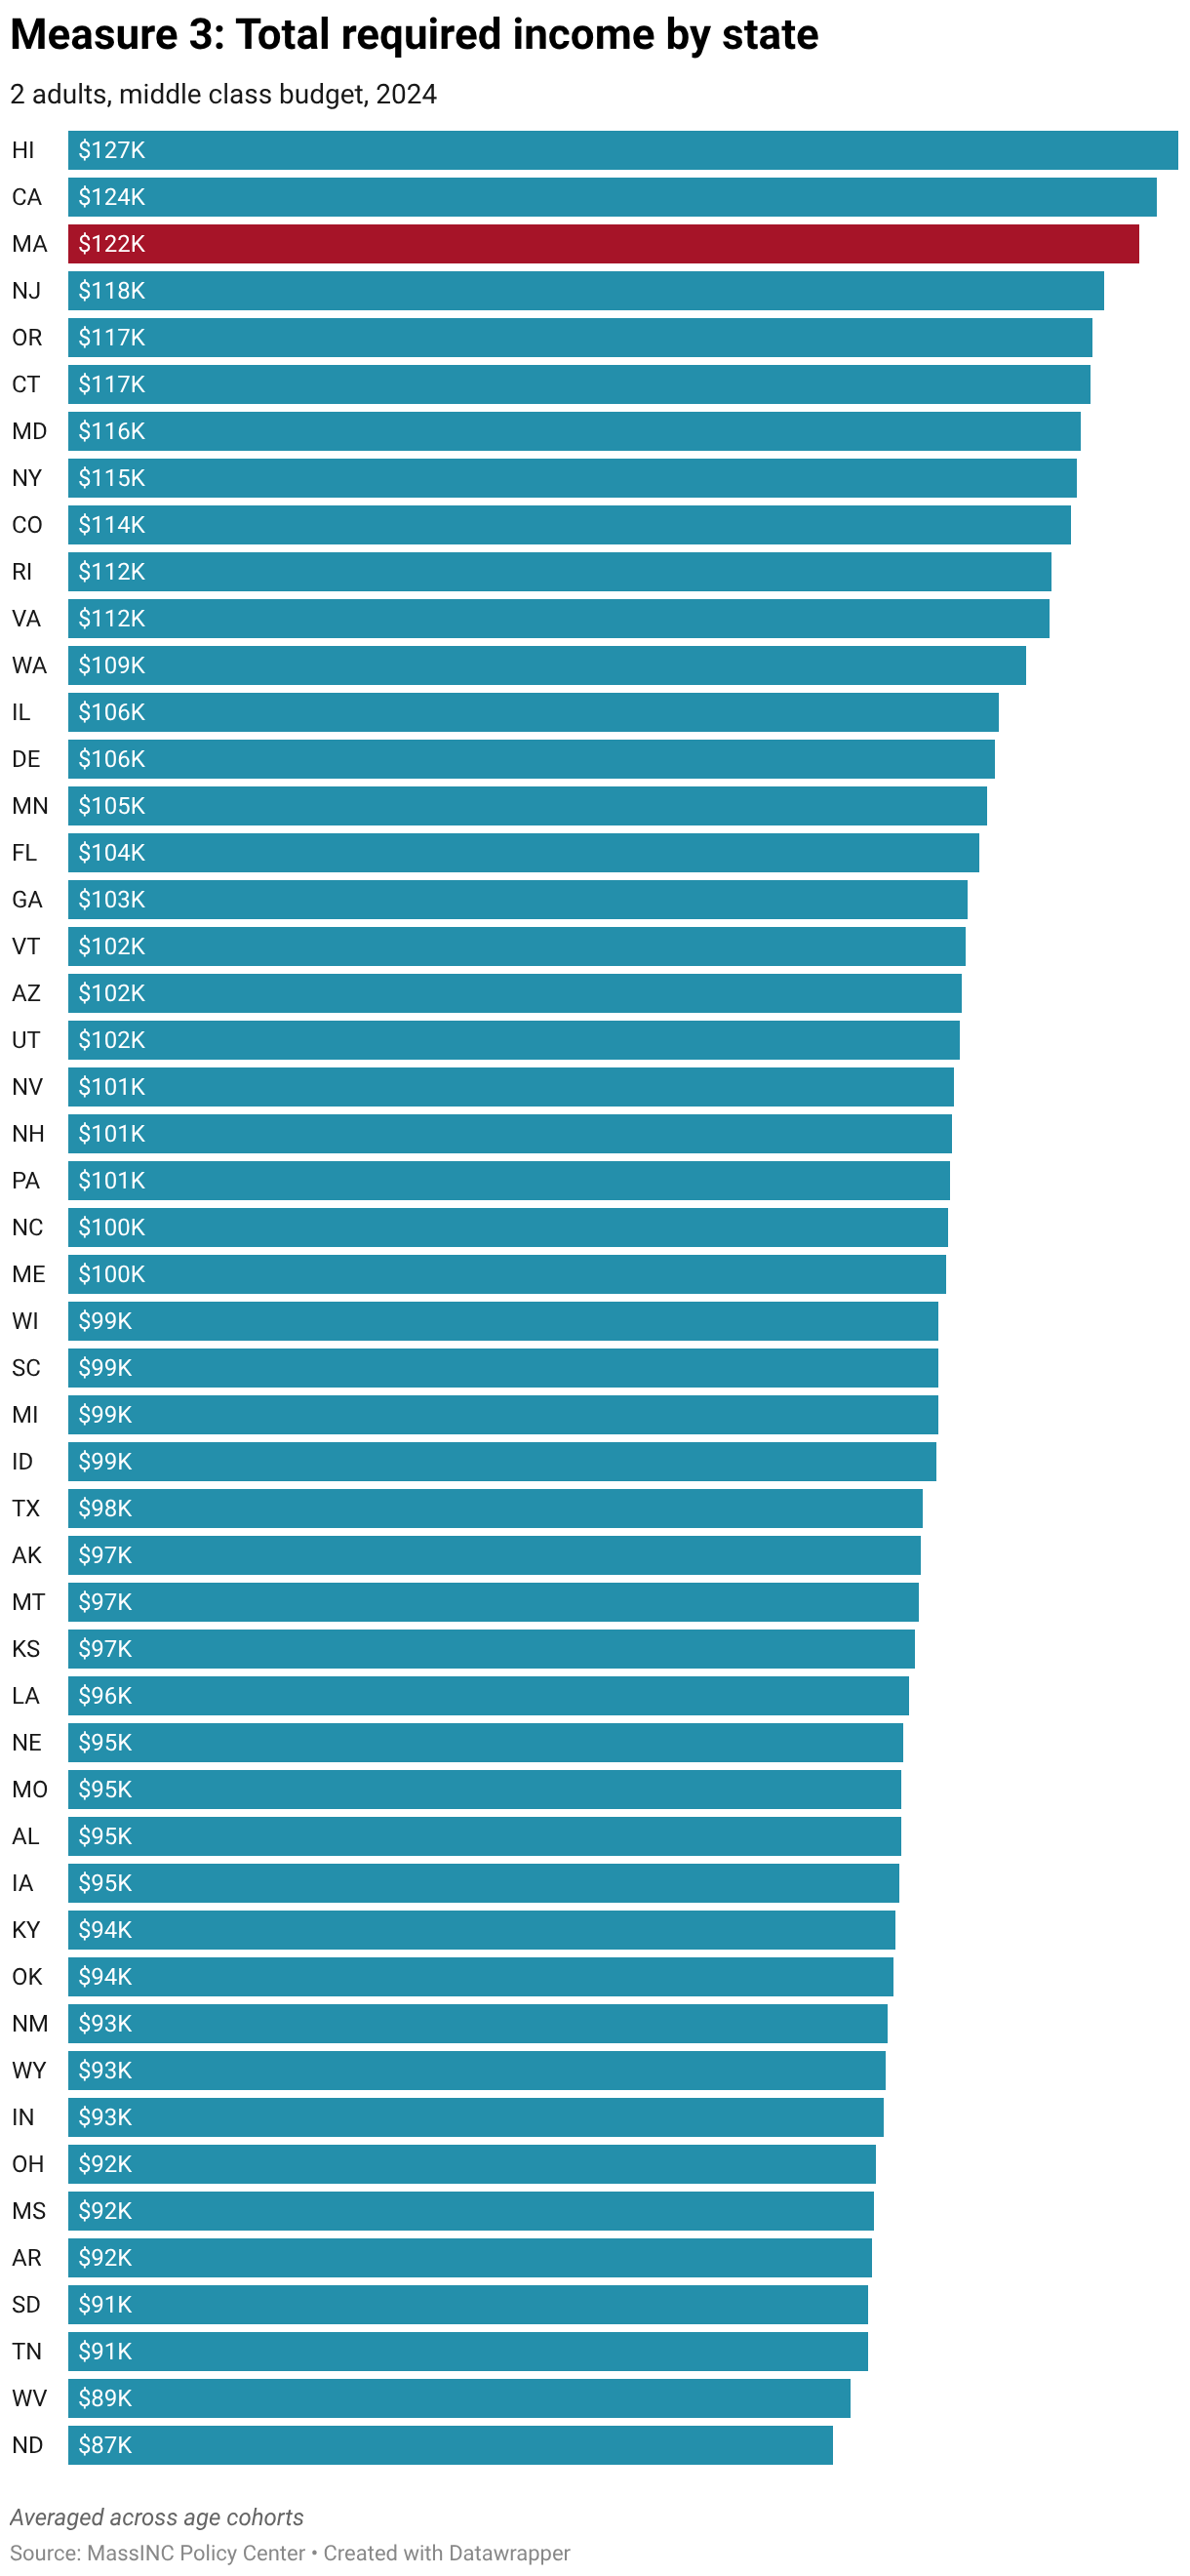
3. Massachusetts Relative to Other US States
California, Hawaii, and Massachusetts are the three most expensive states in the country to sustain a middle-class standard of living across every household type in the model.1 For Hawaii, this result is not surprising: As a geographically isolated island state, Hawaii faces persistently higher costs for food, housing, transportation, and other good and services that must be imported from the mainland.
Between California and Massachusetts, the relative position depends largely on household structure. For adult-only households, California tends to be slightly more expensive, largely because housing costs are higher on average. For families raising children, however, Massachusetts often surpasses California due to higher childcare and education-related expenses. While the two states are broadly similar in their overall tax burdens, differences in housing and family-related costs shift the relative rankings across household types.
The variation is especially visible in the early childhood years. Full-time childcare for two young children averages roughly $46,000 per year in Massachusetts, compared to about $35,000 in California. Higher education costs also diverge. Assuming attendance at a public four-year university and parents covering half of the expected family contribution, annual parental costs average roughly $22,000 for two children in Massachusetts versus about $16,000 in California. As a result, while both states top the highest middle-class budget thresholds for the US, expenses in Massachusetts are especially elevated for families with children.
Certainly, Massachusetts households have some of the highest incomes in the US and a proper examination of costs compared to other states requires income comparisons. Component 2 will show that Massachusetts falls squarely in the middle of the pack for most household types after adjusting for purchasing power.


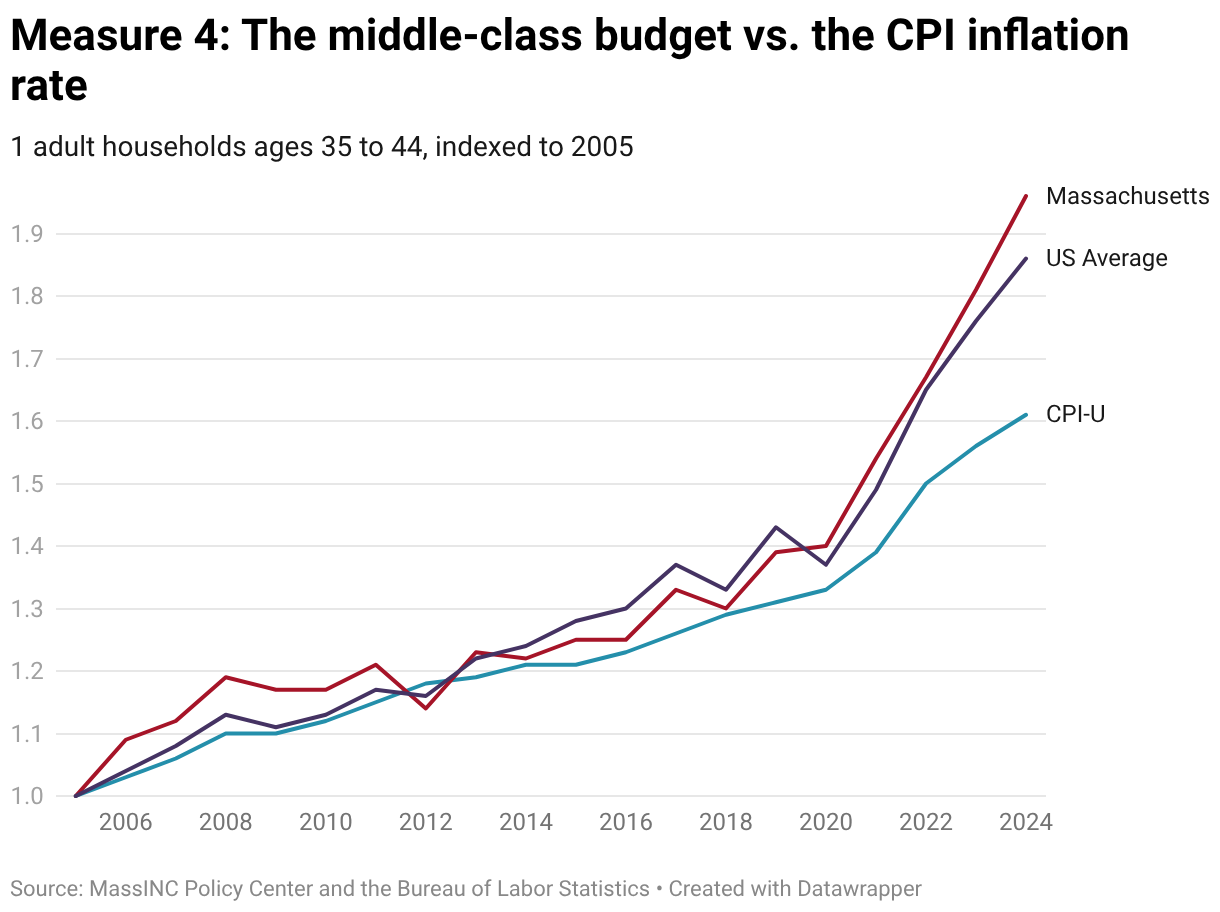
4. Time Trends
From 2005 through 2020, the income required to sustain a middle-class standard of living in Massachusetts moved broadly in line with inflation. But this has not been the case in recent years. For example, the middle-class budget threshold for a single adult rose from roughly $65,000 in 2020 to more than $91,000 in 2024. This 40 percent increase outpaced the Consumer Price Index (CPI) by 18 percentage points.
These cost pressures reflect the unusually strong inflation shock that followed the COVID-19 pandemic. Pandemic-era supply disruptions, rapid shifts in consumption patterns, and a large fiscal stimulus contributed to the fastest national inflation in four decades. Research has shown that the prices of essential goods and services have risen faster than the broader consumption basket used to calculate the CPI.2 Because these necessities make up a large share of the spending required to sustain a middle-class standard of living, the middle-class budget threshold has grown faster than headline inflation.
Relative to other states, the growth in the Massachusetts middle-class budget exceeded the national average throughout the 2000s up until the Great Recession and the housing market collapse. Massachusetts then remained below the national growth rate through the 2010s. While the cost of the middle-class budget has escalated sharply across the country since 2020, it has increased faster than the national average in Massachusetts over the past five years.
5. Time Trends by Component
Over the past two decades, costs central to middle-class stability—especially education, healthcare, and housing—have risen substantially. From 2005 to 2024, housing and child-related expenses accounted for the largest increases in absolute terms. For households headed by adults ages 35 to 44, housing and related costs increased from $20,000 to $44,000. Among families headed by adults ages 26 to 34, annual childcare expenses for two children increased from about $27,000 to $46,000. And for parents age 45 to 54, higher education costs have risen from approximately $11,600 to $22,400.
Because these figures are reported in current dollars, it is important to compare them with overall inflation. Between 2005 and 2024, the CPI increased by about 61 percent. Many items in the middle-class families rose substantially faster. Healthcare costs grew by roughly 151 percent, housing and related costs by 115 percent, higher education contributions by 93 percent, and childcare by 72 percent. By contrast, categories more closely associated with manufactured goods saw far slower growth. Clothing prices, for example, rose just 6 percent in real terms over the full period.
Examining the impact of taxes is more difficult with our model because taxes are a function of income, and the middle-class budget must rise to accommodate growing costs. But we can gauge the influence of tax policy by simply looking at effective tax rates. For instance, the effective state and federal tax rate in Massachusetts for a middle-class family with two children was approximately 24 percent during the study period, with a brief period during the pandemic when it fell below 20 percent. While taxes remain one of the largest expenses that middle-class families shoulder, the current effective tax rates for middle-income households places Massachusetts right at the national average.

6. Post-Pandemic Cost Drivers
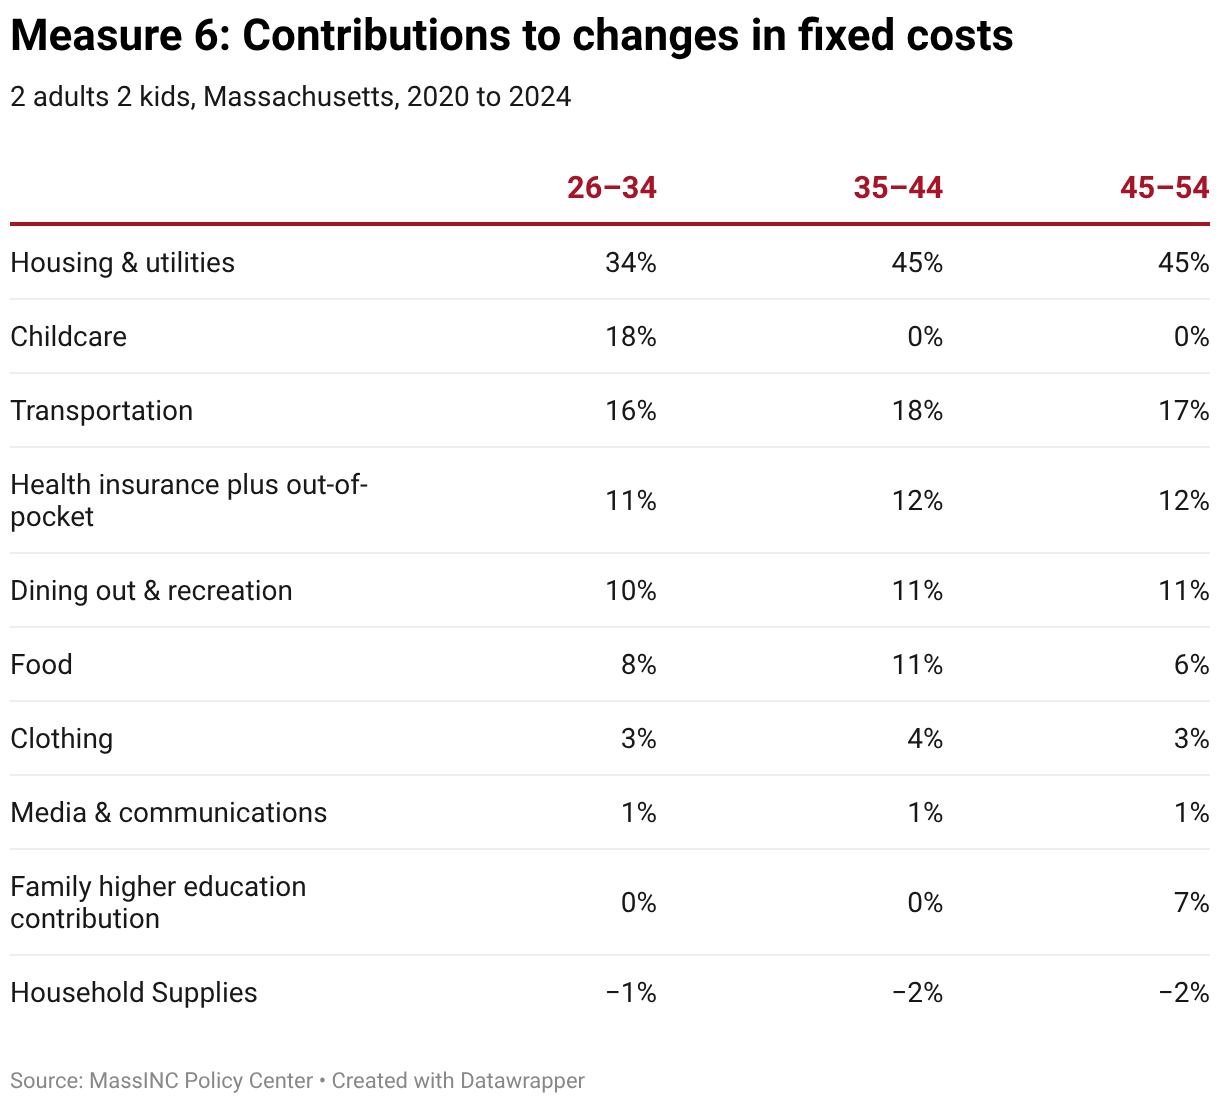
As noted above, most of the growth in the middle-class budget over and above inflation occurred during the post-pandemic period. Measure 6 breaks this cost growth down by core component for several benchmark households.
For example, housing accounted for 53 to 59 percent of the total increase in fixed costs since 2020 for single-adult households. Transportation was the second-largest contributor for this cohort, accounting for 19 to 25 percent, followed by dining out and recreation at just under 10 percent.
For families with children, the composition of cost growth is somewhat different. Housing and related costs remain the largest driver, accounting for roughly 34 to 45 percent of the increase in fixed costs for two-adult households with two children since 2020. Childcare has also been a major cost driver, contributing approximately 18 percent of the fixed cost growth for households headed by adults ages 26 to 34. Transportation, health-related costs, and dining out and recreation account for smaller, but still meaningful shares of the total cost increase.
Adjusting for inflation, it is likely that the increased fixed costs since 2020 have more than offset the real reductions in state and federal taxes that most middle-class households in Massachusetts have enjoyed over the past two decades.
While it is not the largest cost driver, the significant increase in dining out and recreation costs that households have absorbed in recent years may have been an outsized contributor to the economic malaise that many are feeling. These activities represent visible forms of discretionary consumption—the ways families socialize, relax, and enjoy their weekends. When essential costs such as housing, childcare, and taxes rise, households have less discretionary income remaining. If the price of leisure activities rises at the same time, families face a double squeeze: Not only is less money available after covering necessities, but the activities that translate income into quality of life have themselves become significantly more expensive. Because these purchases are frequent and highly visible, they can disproportionately shape perceptions of economic well-being.
Closely examining the composition of the major cost drivers also helps explain why the financial pressures households in Massachusetts and across the US are facing have felt so difficult to address. Economists often describe rising costs in these areas as a symptom of Baumol’s cost disease. Wages tend to rise across the labor market as a whole even when productivity growth is concentrated in some sectors but not others. As a result, in sectors with low productivity growth, the cost of producing services rises relative to the rest of the economy, placing upward pressure on prices. In housing, low productivity growth in construction combines with local supply constraints to play a major role in driving price increases. Housing consumption also has high income elasticity, meaning that as incomes rise households tend to demand more housing, further intensifying upward pressure on prices.

- To simplify cross-state comparisons, we compute the average annual income required to sustain a middle-class standard of living across the major life stages included in the model. This produces a benchmark that reflects the overall cost of maintaining middle-class stability that is smoothed over time. ↩︎
- Ludwig Institute for Shared Economic Prosperity. Living on the Edge: Analyzing the True Cost of Living for Everyday Americans. 2024. ↩︎
The Massachusetts Middle Class Status Report
This special anniversary report will be released by chapter. Please check back for upcoming releases.
Chapters
Introducing the Massachusetts Middle Class Status Report
Component 1: The Middle-Class Budget by Household Type
Component 2: The Size of the Middle Class
Component 3: Work, Leisure Time, and Civic Engagement
Component 4: Economic Security
Component 5: Economic Mobility and the Geography of the Middle Class

The Massachusetts Middle Class Status Report
January 28, 2026