Introduction
To emerge from these difficult times stronger and more competitive, Massachusetts must maintain focus on strategies to leverage its comparative advantages. Near the top of this list are 400 miles of underutilized Massachusetts Bay Transportation Authority (MBTA) commuter rail track. Transforming our commuter rail system from a service designed primarily to bring riders to and from downtown Boston to a true “Regional Rail” network will integrate the state’s regional economies with Greater Boston’s prized economic assets. Every corner of the commonwealth will be more productive, and Massachusetts will be able to accommodate future growth in a manner that protects and enhances quality of life.
Over the past five years, the MBTA has worked to move Regional Rail from an abstract concept to a live project. The agency took the first step in 2019, when its board endorsed recommendations put forward by the Rail Vision Commission. Convened by Massachusetts Transportation Secretary Stephanie Pollack, this diverse mix of public and private sector leaders called for a phased approach to electrify trains, increase service frequency, and speed travel.
The MBTA quickly began to pivot the legacy commuter rail system toward this Regional Rail operating model. In 2020, the authority significantly improved service frequency by spreading the schedule out. Passengers traveling in the middle of the day no longer encounter lengthy gaps between trains. This crucial step forward was possible in part because the COVID-19 pandemic disruption reduced peak-period crowding, so some rush hour service could move to off-peak periods. Long-term investment in Positive Train Control systems also helped; when this new safety technology came online in late 2020, it allowed trains to run closer together, which made it possible to reduce headways on congested lines.1
Clear schedules and affordable fares are also central features of Regional Rail. The MBTA has achieved meaningful progress here as well. With more frequency throughout the day, the commuter rail now operates on a predictable “clock face” schedule. Trains leave each station at the same number of minutes past the hour. This makes it easier for passengers to remember departures without referring to timetables, and it also helps integrate commuter rail with other transit services to facilitate transfers. To make train travel more affordable, the authority made the $10 Weekend Pass permanent in 2019. In 2022, it adopted a 5-Day Flex Pass. And with funding from the legislature, it created the Income-Eligible Reduced Fare (IERF) program in 2024 (see box in Section I for more).
These fare and scheduling changes are already bearing fruit. Among the various modes operated by the MBTA, commuter rail has had the strongest recovery from the pandemic. Ridership is approaching 2019 levels a pace that far exceeds other commuter rail systems in the US, where, on average, only two-thirds of riders have returned.2 While getting back to pre-pandemic levels is an important milestone, it is important to remember that the goal of commuter rail transformation is dramatically increasing mobility. Despite the extraordinary challenges Massachusetts faces, there are several compelling reasons to double-down on the Regional Rail vision now.
First, Regional Rail can help the state’s economy emerge faster from this downturn. The steadily rising Massachusetts unemployment rate is already the highest it has been in a decade, with further increases likely to come. By increasing mobility and access to jobs, Regional Rail will reduce the friction dislocated workers face in finding new jobs.
Additional progress on commuter rail transformation will also help unlock housing production in station areas. Suburbs have created new zoning for dense residential development under the MBTA Communities Law. At the same time, Gateway Cities are using the recent increase in Housing Development Incentive Program (HDIP) tax credits to spur construction in areas with weaker fundamentals. But the value proposition, and ultimately the financial feasibility for many of these transit-oriented development (TOD) projects, hinges on fast, frequent, affordable, and reliable transit service. Improving transit to catalyze housing production in locations that make for easy commutes is likely one of the most effective steps policymakers can take to reposition the Massachusetts economy for growth.
Public sentiment is a third powerful argument for leaning into commuter rail transformation at this challenging crossroads. While it is more intangible and difficult to quantify, there is no question that the Purple Line is a highly visible public good and a unique hallmark for the commonwealth. Our ability to maintain and improve the performance of this vital asset will increase the public’s belief in a bright future for all of Massachusetts. And public confidence is a powerful driver of economic growth.
Achieving the full vision for Regional Rail will take many years and it will require considerable upgrades to existing infrastructure and rolling stock. However, there are meaningful steps that Massachusetts can take immediately to build on the progress that it has made since 2020, and to send a clear signal that it is not going to abandon this critical projects. These actions include:
- Leveraging new fare collection technologies and strategies to maximize ridership and revenue and ensure that all residents have equitable access to this essential public transportation mode.
- Developing a clear capital plan to finance improvement projects that significantly increase speed and frequency, coupled with permitting, procurement, and other reforms to accelerate delivery, lower the cost, and increase return on public investment.
- Building on the MBTA Communities Law with coordinated land use policies to ensure that growth can occur around Regional Rail stations in line with the potential of this major economic asset.
In a series of policy briefs, the MassINC Policy Center and TransitMatters will dig deeper into each of these components, beginning with fare technology and policy. Fares are an important source of operating revenue. At the same time, the price of travel can have a considerable impact on ridership. With new fare collection technology coming online, the authority now has far greater ability to vary fares dynamically, optimally balancing revenue and ridership to maximize the public benefits that the service produces.
To lay the ground for a deeper examination of fare policy, we begin by exploring the impact of early progress toward Regional Rail on ridership. Next we quantify the significant potential to increase passenger volume on all of the lines at current service levels. Our analysis then looks at pricing in the context of efforts to ensure that Regional Rail expands economic opportunity for low- and moderate-income residents. We conclude by outlining strategies to continue building ridership through efficient, effective, and equitable changes to fare policy.
What is Regional Rail?
Regional Rail envisions a commuter rail centered around a modern, electric network and a fleet of vehicles to bring rapid-transit-like, frequent, and reliable service to the Greater Boston region, Gateway Cities, growing suburbs, and beyond. The full vision first put forward in 2018 by TransitMatters includes five components:
- Strategic infrastructure investments to relieve bottlenecks and speed restrictions.
- Systemwide electrification and the purchase of high-performance electric trains.
- Frequent service all day, a minimum of every 30 minutes system-wide, and every 15 minutes at high-demand stations.
- High platforms to provide universal access and speed up boarding for everyone.
- Free transfers between subways and buses; fare equalization within the subway’s service area; cheaper fares overall; means-tested fares for low-income riders.
Massachusetts is moving incrementally forward on each of these components. However, at present, the system still functions more like conventional commuter rail. In this regard, we use the term commuter rail throughout this analysis when describing current conditions and Regional Rail when referring to the system’s potential when all five components are in place.
I. Evaluating the Ridership Impact of Early Progress on Commuter Rail Transformation
A recent study published by the Transportation Cooperative Research Program found that the MBTA is the only commuter rail system in the US that has nearly recovered to pre-pandemic levels.3Others steadily regained traffic until the summer of 2022, but the highest performers peaked at 70 percent of 2019 levels. Chicago’s Metra stalled at around 55 percent, and Caltrain in the Bay Area and MARC Tran in the Baltimore-Washington corridor still hover around 40 percent of pre-pandemic ridership. The analysis attributes the MBTA’s outsized performance to schedule changes.
These adjustments have given off-peak riders far more trains to board. While those traveling during the peak now have fewer trains, they are much better positioned to make midday return trips home, if needed. Spacing trains out has also led to performance improvements, with significantly more trains arriving on time. And the new schedule features legible “clockface” departures, so people know when the trains will be coming without having to consult timetables.
New data from both ridership surveys and station-level passenger counts allow for a more comprehensive view of how the initial steps that the MBTA has taken to transform commuter rail have already boosted ridership. A close inspection of these patterns can help inform strategies to build ridership with variable pricing.
Changes in the General Characteristics of Commuter Rail Riders
Comparing passenger surveys conducted by the MBTA during the pre- and-post 2020 periods provides an indication of how ridership is changing both system-wide and line-by-line.4Amidst pandemic-induced travel adjustments, the data presented below suggest:
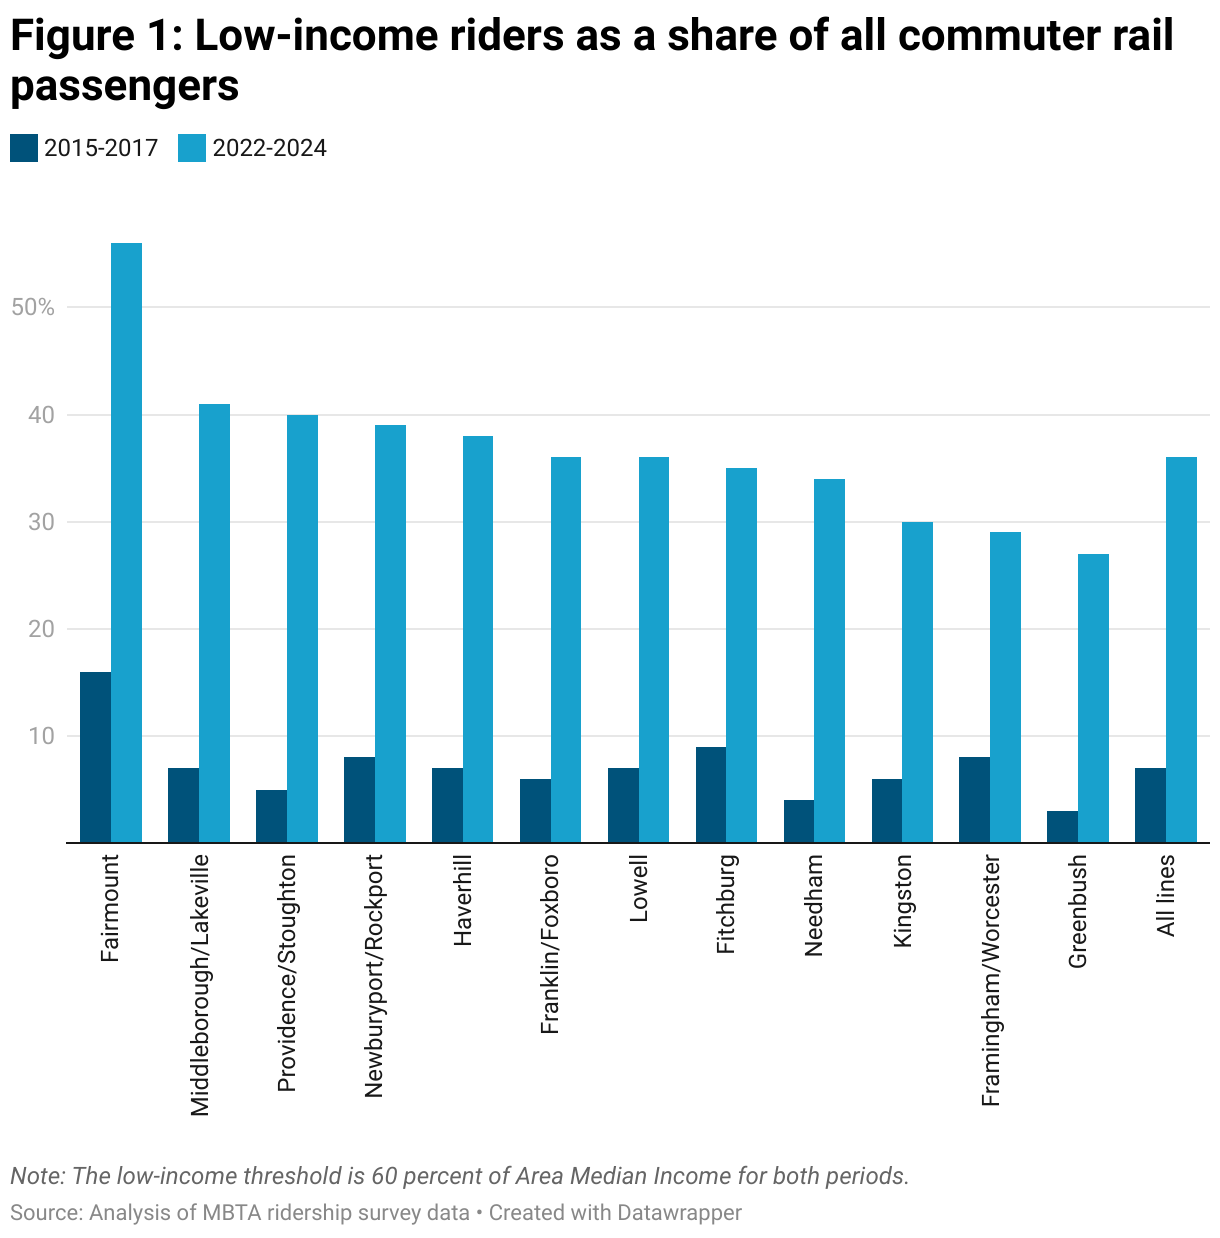
- Early progress toward Regional Rail has made the system far more accessible to low-income residents. Across all lines, low-income passengers (those with income below 60 percent of area median income) now make up 36 percent of commuter rail riders according to surveys collected between 2022 and 2024 (Figure 1). While this is still 26 percentage points below the MBTA system-wide average, it is a dramatic increase from surveys taken between 2015 and 2017, when low-income residents made up just 7 percent of commuter rail passengers. Excluding Fairmount, which runs entirely in Boston, the Middleborough/Lakeville line has the highest low-income ridership (41 percent), while Greenbush has the lowest (27 percent). Relative to the 2015 to 2017 surveys, the Providence line saw the steepest increase in low-income ridership (+35 percentage points).5
Most of the responses to the 2022 to 2024 surveys were collected prior to implementation of the Income-Eligible Reduced Fare Program (IERF). As more residents become aware and take advantage of IERF, there is likely to be additional growth in low-income ridership. However, it is important to note that the ridership survey counts those with income below 60 percent of area median income (AMI) as low-income, and that more recently the MBTA increased the threshold to 80 percent of AMI. To quality for IERF, households must be below 200 percent of the federal poverty level (FPL). In Boston, 80 percent of AMI for a two-person household is $105,000, whereas 200 percent of FPL is just $42,000.
- Early progress toward Regional Rail has increased mobility for those without vehicles. Nearly one-quarter of commuter rail passengers do not have a vehicle in their household. This is up from only 5 percent of riders back when the 2015 to 2017 surveys were taken. On the Framingham/Worcester and Fitchburg lines, around 30 percent of riders do not have access to a vehicle.
These figures suggest train service increasingly provides households with the ability to travel without owning a private vehicle. To the extent that service improvements make it possible to reach more places by walking, biking, or taking public transit, investments in Regional Rail will boost mobility without adding congestion to roadways.
- Early progress toward Regional Rail has increased ridership among those living in close proximity to the stations. Commuter rail ridership surveys show that a growing share of passengers live within walking distance of a station. Roughly half of riders (53 percent) responding to surveys between 2015 and 2017 walked or biked to the train. Results from the 2022 to 2024 surveys show this fraction has increased to two-thirds of riders. The walking/biking shares are highest on the Needham line (79 percent) and the Franklin/Foxboro line (71 percent), which both have several stops within the city of Boston, as well as in dense inner suburbs.
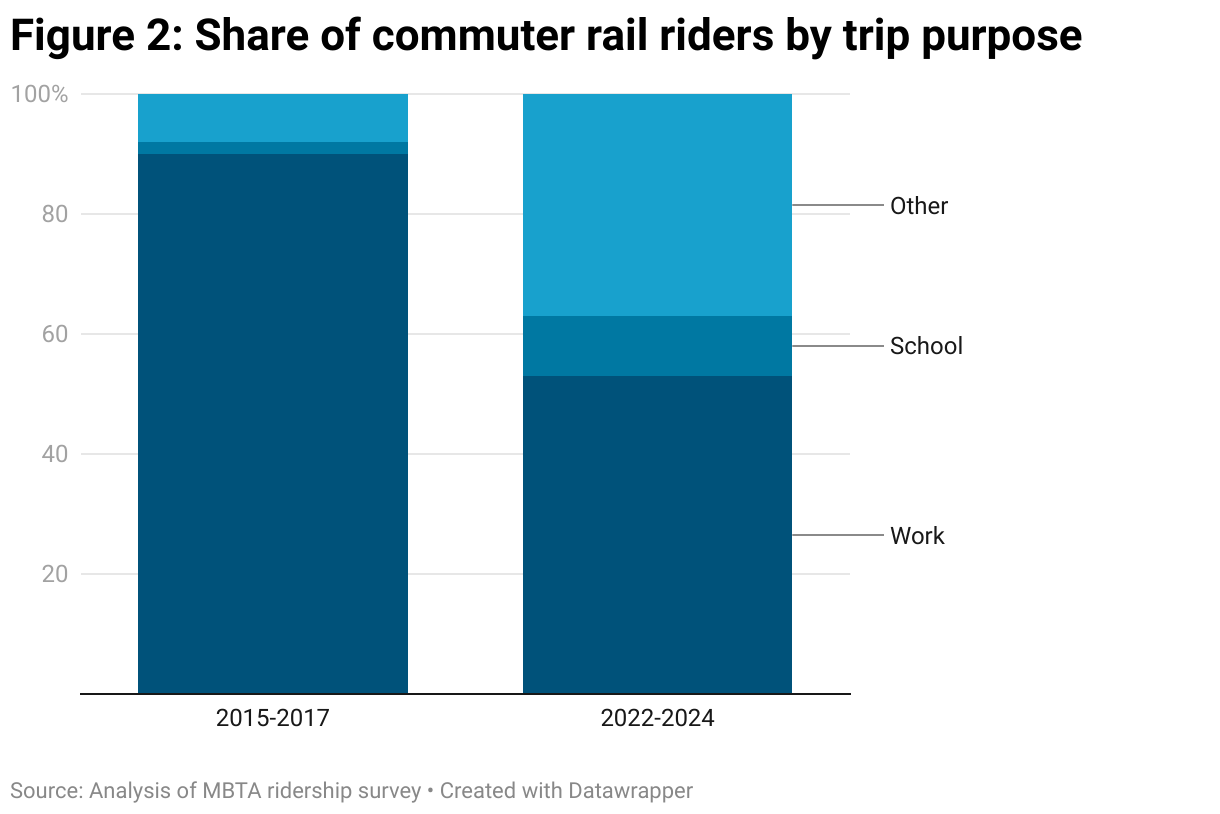
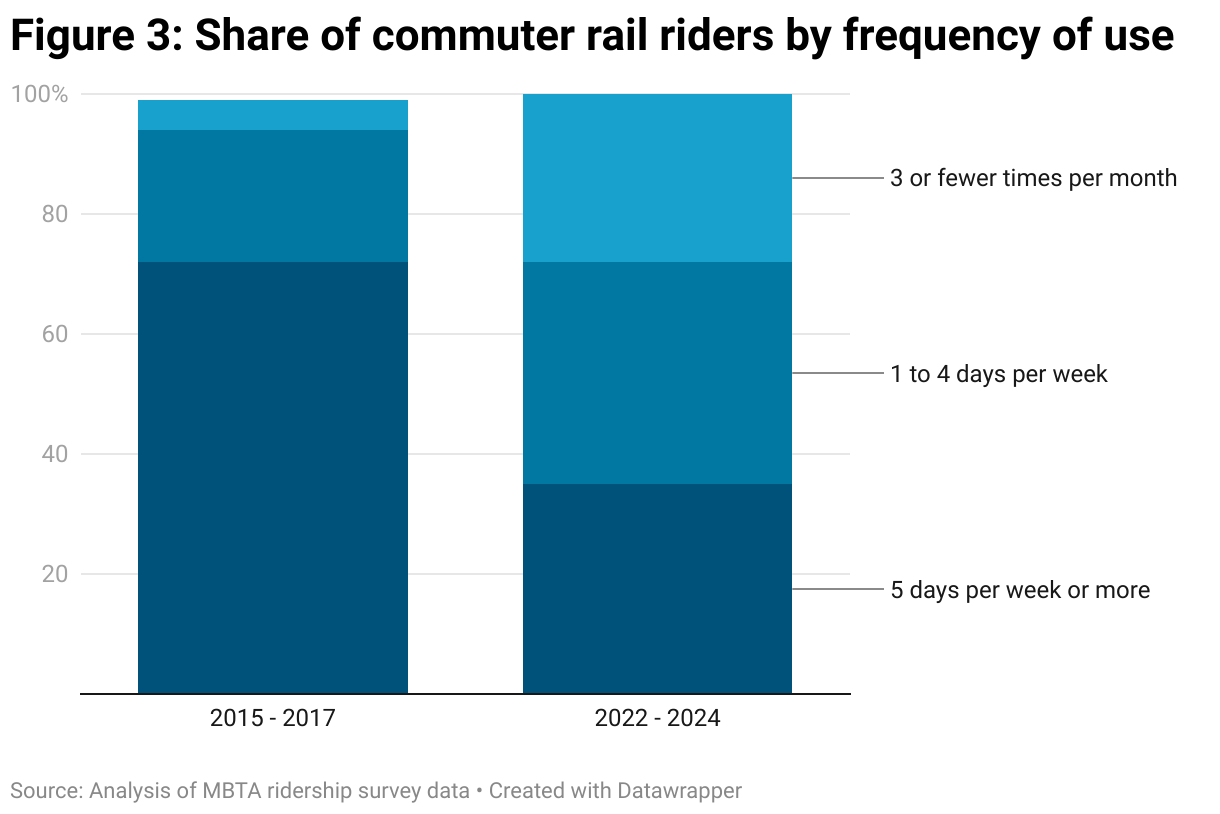
The large and growing share of riders walking and biking to the station suggests transit-oriented development is a key demand driver. This means the MBTA has a vital interest in ensuring that the land around each station is designed and developed in a manner that maximizes future ridership. As recent research by Boston Indicators and TransitMatters shows, there is considerable opportunity to generate a virtuous cycle with improved transit service fuels development, and, conversely, development at higher “transit-supportive densities” generates new ridership.6 - Early progress toward Regional Rail has increased mobility for those making non-work trips. Another striking difference in the post-pandemic, post-schedule change period is the increase in the number of riders traveling for reasons other than employment (Figure 2). Commuters making their way to work made up 90 percent of all riders on the 2015 to 2017 surveys. In comparison, only about half (53 percent) of passengers surveyed in the 2022 to 2024 period were on their way to work.7 This change is also apparent in frequency data. The share of riders traveling 5 days per week or more declined by 37 percentage points. There was a significant increase in those traveling 1 to 4 days per week (+15 percentage points), reflecting the shift to hybrid work schedules. But the biggest change was among those using commuter rail three or fewer times per month (+23 percentage points). These passengers now make up more than one-quarter of riders (Figure 3).
Commuter rail’s economic benefits are arguably greatest with respect to facilitating travel for the purpose of employment. Strong service increases access to labor and jobs, boosting labor productivity by allowing for better matches between employers and workers. But increasing mobility for non-work trips also makes Massachusetts more productive when it gives residents more opportunities to receive high-quality education and health care (as well as health supporting-social contact). Travel enabled by Regional Rail will also strengthen the Massachusetts economy if more people are out spending a higher share of their disposable income on locally produced goods and services. And to the extent that additional train trips replace automobile travel, Regional Rail service will reduce congestion and pollution, which also has valuable economic benefits.
Changes in Gateway City Ridership
Passenger counts collected at every commuter rail station last fall provide another indication of how early progress toward the Regional Rail operating model has impacted weekday ridership. These tallies occurred at each station on a single day (a Tuesday, Wednesday, or Thursday), so it is difficult to draw conclusions about changes at stations with relatively low ridership. However, Gateway Cities generally serve a large number of riders. Moreover, these dense, mixed-use urban centers should see more immediate benefits from early progress on Regional Rail.
While most Gateway City stations have seen a decline in weekday ridership similar to the system-wide average, the newly available passenger count data reveal two promising patterns for regional economic development:
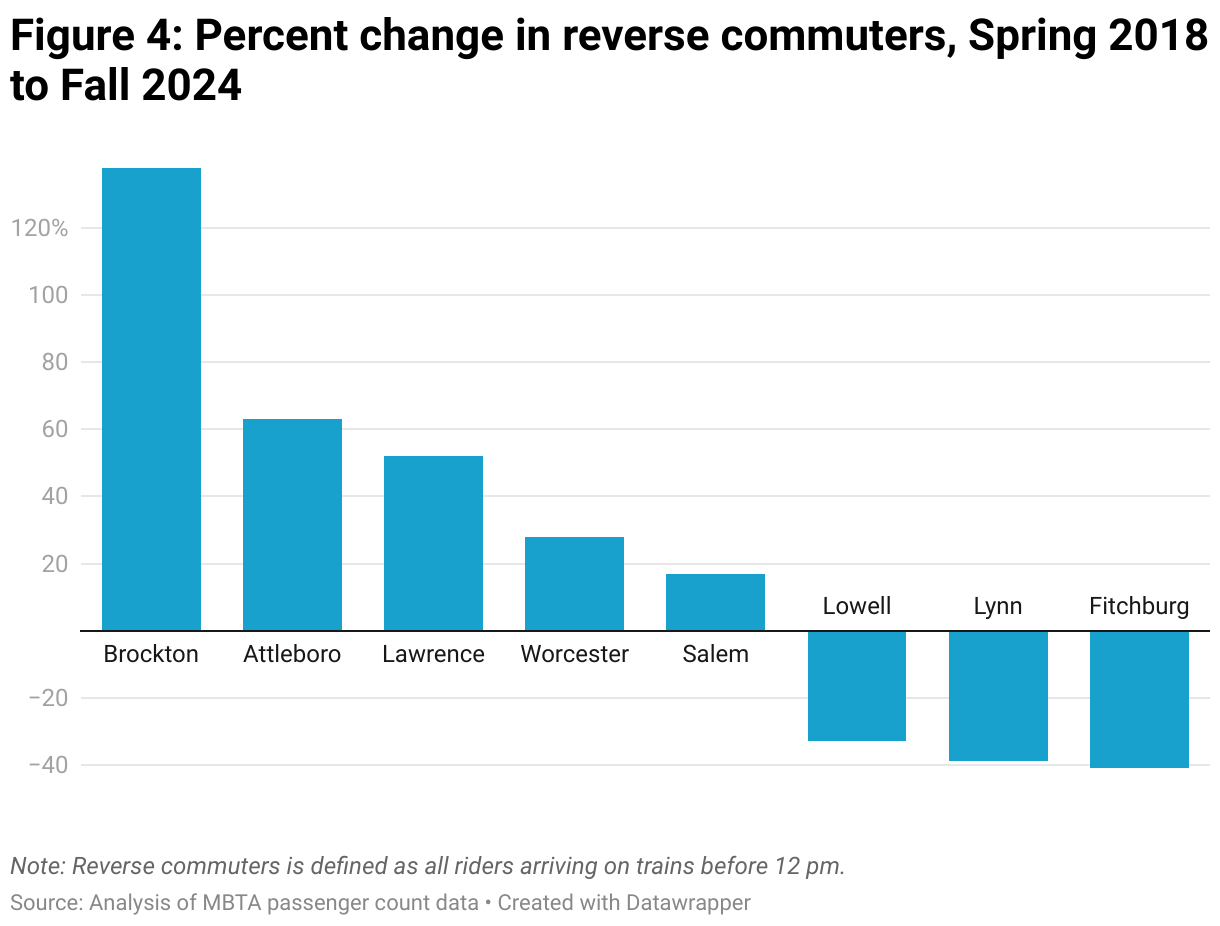
- The number of reverse commuters to Gateway Cities has increased significantly. On average, the number of riders reverse commuting to Gateway Cities grew by 23 percent between 2018 and 2024. Brockton saw the largest gain, with a 138-percent increase in riders arriving on AM trains from Boston. Attleboro also had a large increase (63 percent). Growth in reverse commuters in Lawrence (+52 percent) contrasts sharply with the station’s overall decline in ridership (-38 percent). However, this positive reverse commute trend was not universal. Three Gateway City stations saw significant declines in reverse commuters (Lowell, Lynn, and Fitchburg). But given the influence of line-specific services disruptions and random variability, especially with the relatively small number of reverse commuters, change at the city level should be interpreted cautiously (Figure 4).
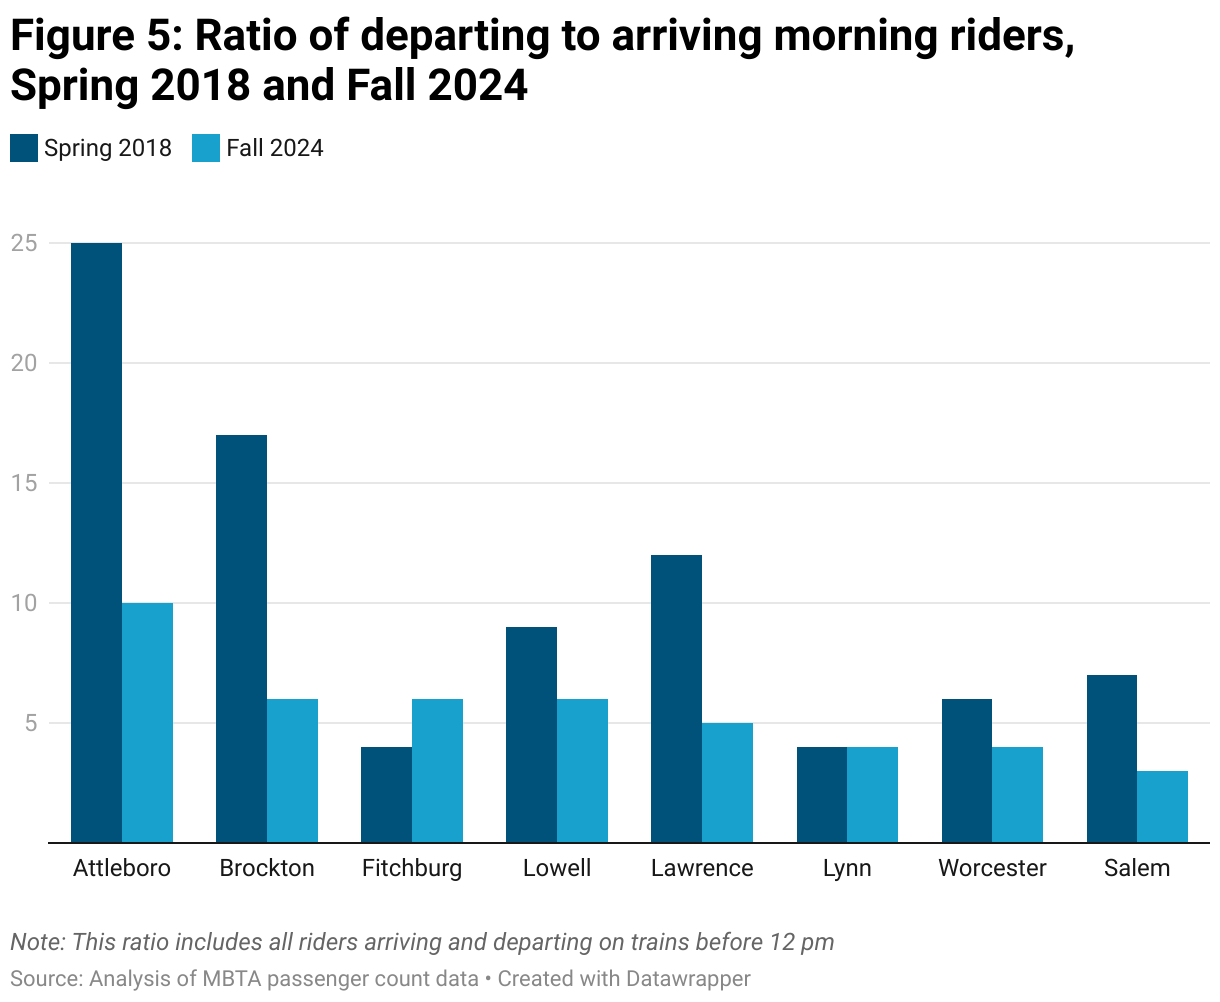
Assuming the bulk of reverse-commuting passengers are traveling for work, reductions in trips to Boston paired with an increasing number of reverse commuters has led to a somewhat more even exchange of labor between Boston and the Gateway Cities. On average, the ratio of AM riders leaving on trains to Boston to AM riders arriving on trains from Boston fell from 10 to 1 in 2018 to 5 to 1 in 2024. In Salem, there are now only 3 riders leaving for each one entering. Lynn and Worcester are also well below the 5- to-1 average. The shift from 17-to-1 to 6-to-1 in Brockton is especially notable given that the Brockton station did not see a sharp decline in departing riders over the period (Figure 5).
- Growth in interzone travel has generated ridership increases for several Gateway Cities. Tracking interzone ridership (i.e. those who embark from a community other than Boston) is difficult because the passenger counts do not link the origins and destinations for each passenger.8However, the number of riders on Boston-bound trains that disembark at the five Gateway City stations located at a midpoint provides one indication of interzone travel, and the number of passengers utilizing the system in this manner appears to be on the rise.9Salem saw a 122-percent increase in riders arriving on trains bound for Boston. In Brockton and Attleboro, the growth was 65 percent and 51 percent, respectively. While there were declines in Lynn (-11 percent) and Lawrence (-43 percent), the average across the five Gateway City stations with observable interzone travel by this method was positive (+37 percent).
Counting passengers boarding trains moving outward from Boston at stations that are not in the Boston/Cambridge core is another way to measure interzone travel.10 While we cannot determine where these passengers disembark, it is likely that many are traveling to urban centers along the line. Growth since 2018 by this measure was mixed. The Fitchburg and Worcester lines saw modest increases of 11 and 13 percent respectively. However, non-Boston/Cambridge outbound ridership was down on the Lowell (-27 percent) and Haverhill lines (-28 percent).
The State of Fares Today
Commuter Rail fares are split into 11 pricing zones (Zone 1A through Zone 10) based primarily on distance from downtown Boston. One-way fare tickets begin at $2.40 for downtown stations and reach $13.25 in Zone 10. Monthly passes are offered to all riders, starting from $90 for Zone 1A and rising to $426 for Zone 10.
In 2015, the MBTA/Massachusetts Department of Transportation board outlined three key principles for commuter rail fare policy: increase revenue, improve service and customer experience, and advance social, equity, environmental, and regional economic goals.11 Several new fare products have been introduced in recent years to further these goals. They include:
$10 Weekend Pass. This product provides unlimited rides to all destinations on weekends and holidays for a flat $10 fee. Since its introduction with a 2018 pilot, the MBTA has seen a surge in weekend ridership, reflecting strong demand for low-cost, convenient options for recreational trips.
5-Day Flex Pass. Created in 2022, this product is designed to serve riders working a hybrid schedule. Riders c. Each pass gives riders unlimited travel over a 24-hour period and riders must utilize them all within 30 days of purchase. With prices varying by zone, the cost is 10 percent less than five equivalent round-trip tickets.
Income-Eligible Reduced Fare Program (IERF). The MBTA has long offered reduced fares to specific rider groups, including seniors, youth, and individuals with disabilities. In September 2024, the MBTA launched a significant expansion of its reduced fare offerings with the introduction of the IERF program, designed for riders between the ages of 18 and 64 who earn less than 200 percent of the federal poverty level. Riders who can demonstrate that their income falls below this level through participation in certain public benefit programs receive a roughly 50-percent discount on commuter rail tickets and passes.
| Zone | One-way Fare | Reduced One-way Fare | Percent Discount | Monthly Pass | Reduced Monthly Pass | Percent Discount |
| 1A | $2.40 | $1.10 | 54% | $90 | $30 | 67% |
| 1 | $6.50 | $3.25 | 50% | $214 | $102 | 52% |
| 2 | $7 | $3.50 | 50% | $232 | $111 | 52% |
| 3 | $8 | $4 | 50% | $261 | $125 | 52% |
| 4 | $8.75 | $4.25 | 51% | $281 | $131 | 53% |
| 5 | $9.75 | $4.75 | 51% | $311 | $147 | 53% |
| 6 | $10.50 | $5.25 | 50% | $340 | $165 | 51% |
| 7 | $11 | $5.50 | 50% | $360 | $175 | 51% |
| 8 | $12.25 | $6 | 51% | $388 | $185 | 52% |
| 9 | $12.75 | $6.25 | 51% | $406 | $194 | 52% |
| 10 | $13.25 | $6.5 | 51% | $426 | $204 | 52% |
II. Quantifying Regional Rail’s Passenger Capacity
Drawing on last fall’s passenger counts, this section compares commuter rail ridership levels today to the system’s total potential passenger capacity under the current schedule. We quantify the additional passenger capacity on each line and break these figures down into additional peak, reverse-commute, and off-peak capacity. At full implementation, Regional Rail will provide more trips, but with smaller single-level coaches and shorter trainsets. As such, this analysis is intended only for illustrative purposes. The figures below offer an order-of-magnitude indication of the extremely large throughput that these rail lines offer, and they help demonstrate the opportunity that variable pricing by direction and time-of-day presents to increase both ridership and the economic development impact of the service.
Total Additional Passenger Capacity
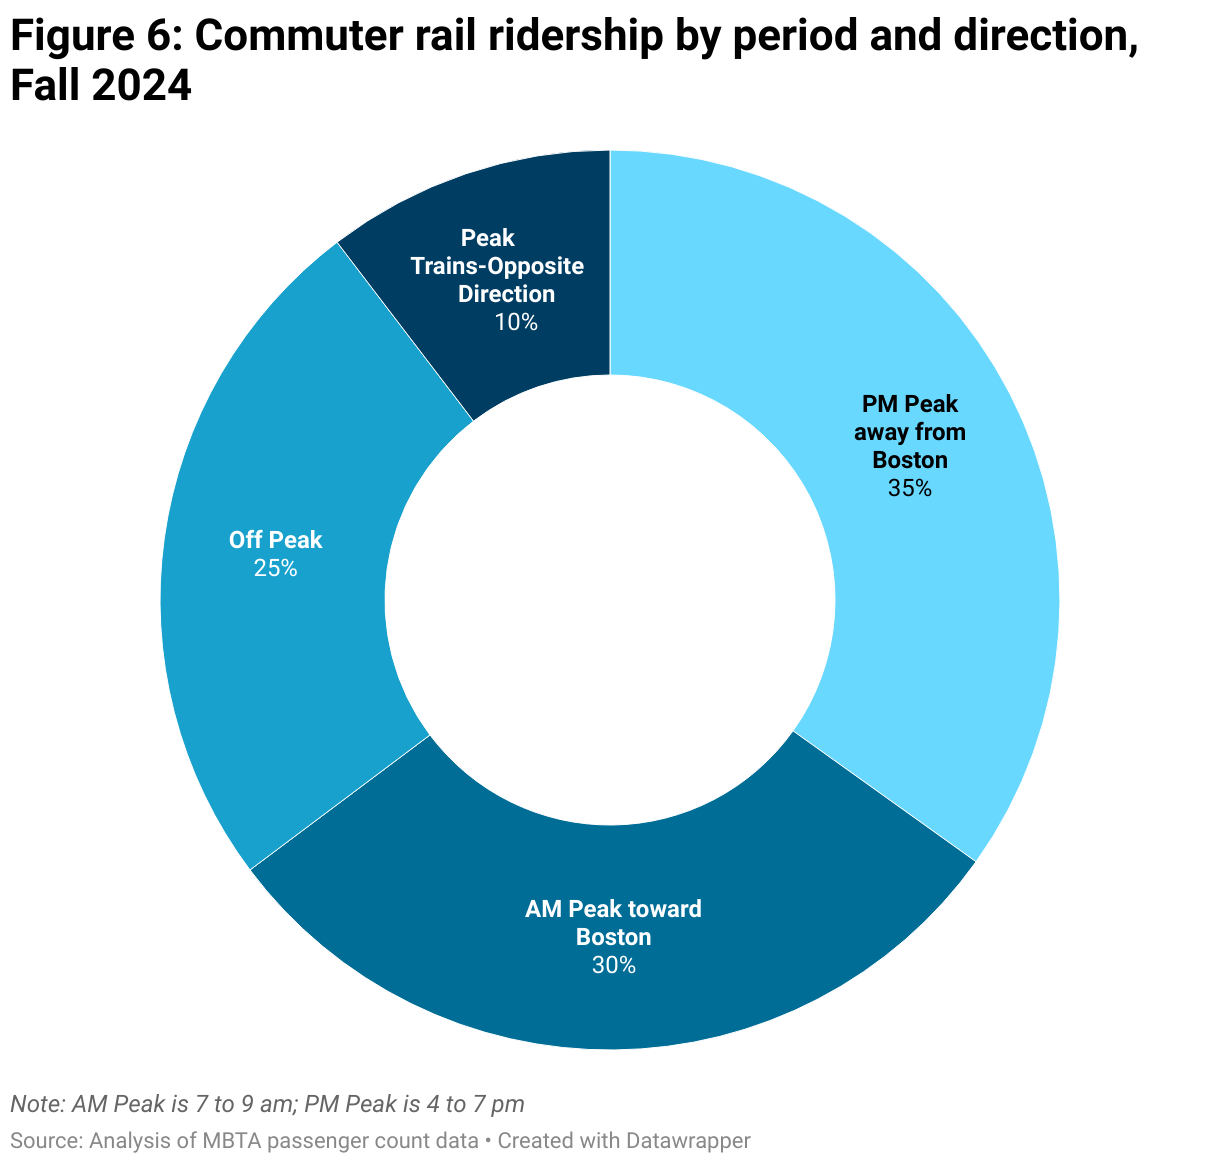
In the Fall of 2024, the MBTA commuter rail system operated 514 week-day train trips: 61 during the A.M. peak (7 to 9 a.m.) moving toward Boston, 76 during the P.M. peak (4 to 7 p.m.) moving away from Boston, 103 during the A.M. and P.M. peak travel periods moving in the opposite direction, and 274 moving in either direction during off-peak periods. Together, these trains moved just under 100,000 passengers, with about two-thirds of all riders moving during the peak period in the peak direction (Figure 6).
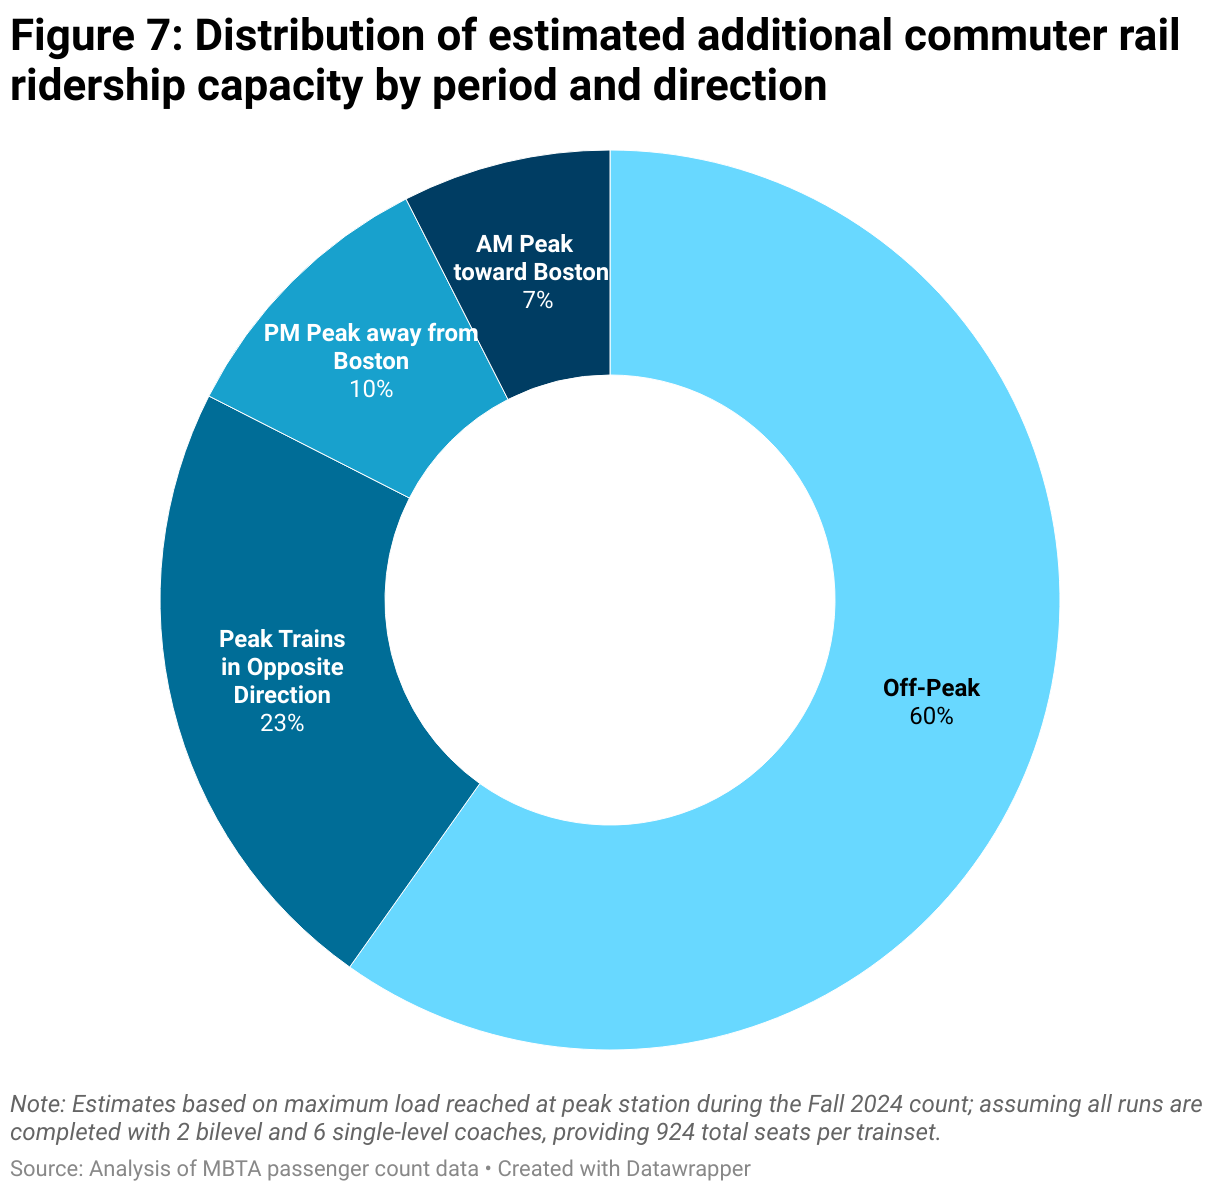
All told, these trains held capacity to carry nearly 400,000 additional passengers (modeling capacity with a prototypical trainset of two bilevel coaches and six single-level coaches), a 400-percent increase over current weekday ridership levels.12 The bulk of this additional capacity is available during the off-peak period, as well as during the peak period in the opposite direction. However, there is considerable room to move more riders all throughout the day (Figure 7). To put this excess passenger volume into perspective, 30,000 riders are roughly equal to the number of drivers traveling north toward Boston on the Southeast Expressway during the morning commute. For comparison, the entire 10-lane Central Artery coursing through the heart of the city was designed to move 250,000 vehicles per day.13
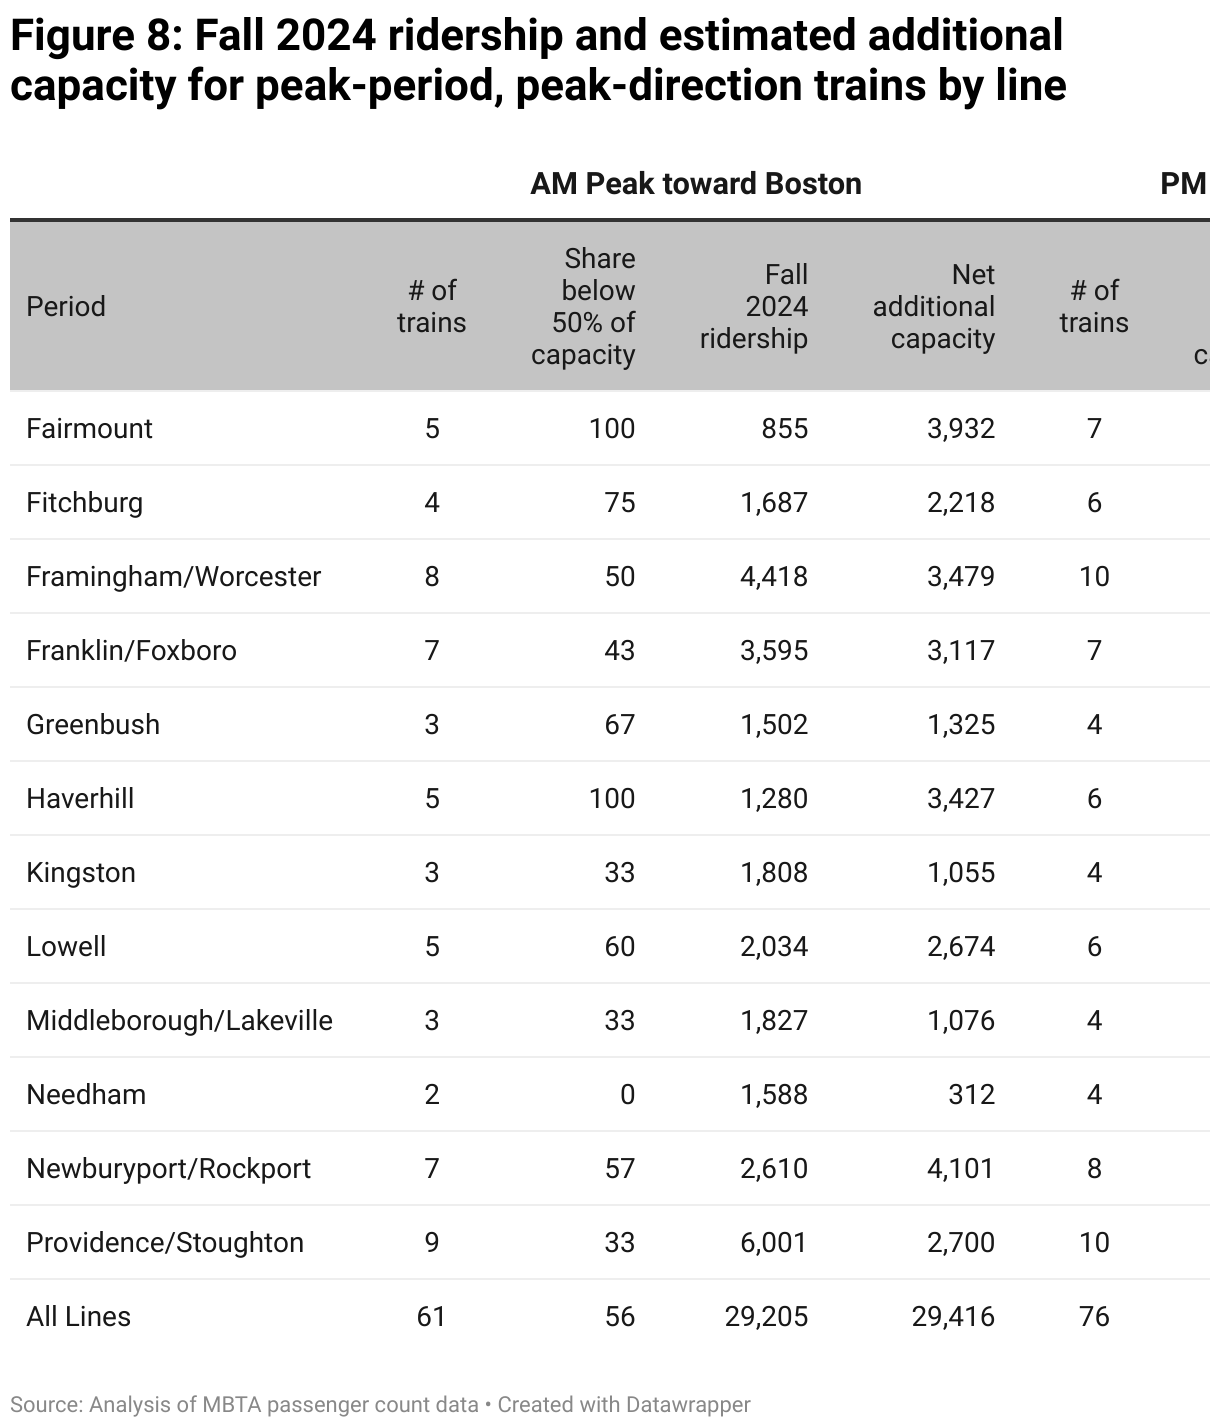
All lines have considerable additional passenger capacity, though some have substantially more than others (Figure 8). Because it has significantly more runs, the Providence line, which serves Attleboro, can accommodate the most new riders. This is followed by the Fairmount and Newburyport/Rockport (Lynn and Salem) report lines. The Middleboro/Lakeville (now Fall River/New Bedford) line has the least additional capacity due to its relatively limited schedule. Capacity could present a unique challenge for this line in the future. With the introduction of South Coast Rail, it now serves a total of five Gateway Cities (Brockton, Fall River, New Bedford, Quincy, and Taunton). Together, these urban centers house nearly 500,000 residents and their dense urban fabric gives them very significant transit-oriented development potential.
Additional Peak Period Capacity
While commuter rail ridership has recovered faster than other public transit modes and there are several trains where overcrowding forces passengers to stand during both the morning and afternoon rush, the Fall 2024 passenger counts show that there is still significant capacity to carry more riders during peak periods.
For more than half of trains headed to Boston during the AM peak, the maximum load reached along the run did not exceed 50 percent of capacity. Inbound ridership during the mornings could increase by almost 30,000 passengers, which equates to twice the current passenger volume. The Newburyport/Rockport line has the most excess capacity in the morning, followed by Fairmount. With only two inbound trains operating during the morning peak, there are very few open seats on the Needham line.
Nearly two-thirds of trains depart Boston at less than 50 percent of capacity during the P.M. peak periods (Figure 8). These trains could carry nearly 40,000 more passengers, which is 115 percent more than the current total. Additional peak period capacity is especially high on the Newburyport/Rockport line. During the afternoon commute, the Fairmount line also has relatively more peak capacity. While the Kingston line is the most congested in the afternoon, it could still accommodate more than 14,000 additional passengers.
Additional Reverse Commute and Off-Peak Capacity
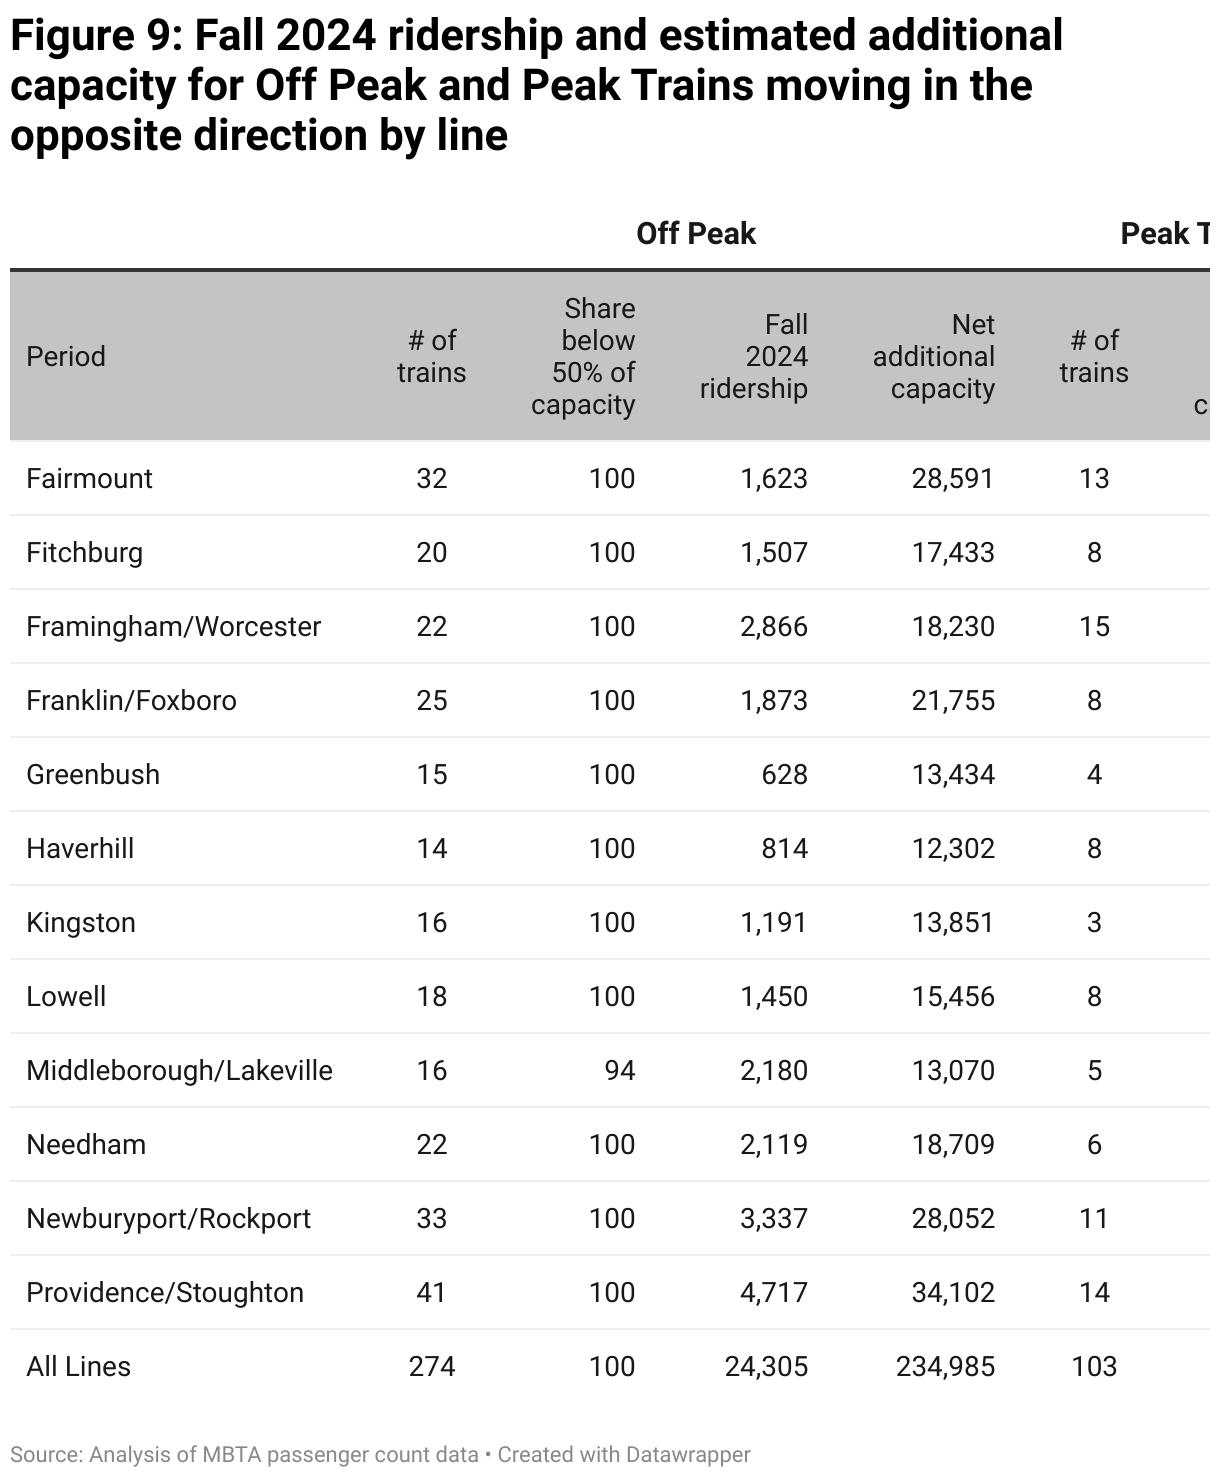
There is far more capacity to grow reverse-commute ridership, as well as ridership during off-peak periods (Figure 9).
With the fall 2024 schedule, trains moving outbound from Boston during the AM peak could carry 38,000 more riders. And afternoon peak trains moving inbound could accommodate over 50,000 additional passengers. However, the largest source of additional capacity is off-peak trains moving in either direction. Together, these 274 trips could move 235,000 more riders, if seats were fully occupied.
To be sure, there is no realistic scenario in which the MBTA fills every seat on every train. Full Regional Rail service can support more balanced economic development and more even travel flows over time as development patterns respond to service improvements, but the Boston core will always remain the center of gravity for the system. And while travel is certainly less concentrated during traditional peak periods and Regional Rail will enable more flexible scheduling, there will always be significantly larger passenger volumes during peak periods. Both the scheduling and the fleet must reflect these heavier loads, meaning that trains moving against the current will inevitably have many open seats.
Still, there are two reasons why the agency has a strong interest in variable pricing and other strategies that maximize ridership on trains moving off-peak and in the reverse direction:
First, there is potential to generate additional revenue for the system. Operating trains to enable peak travel is a fixed cost. So if policies to attract more off-peak/reverse direction riders cost the MBTA less than the marginal cost to carry these additional riders—and the lost revenue from discounts to the small number of existing riders using the service in this manner today is less than the revenue gains from induced ridership—the authority will produce more net revenue in the aggregate.
Second, Regional Rail fundamentally seeks to shape development patterns (both residential and non-residential) over the long term, so that there are far more origins and destinations to serve within these rail corridors. Pricing that increases ridership throughout the day means more patrons to support businesses within the station areas. And the more businesses that these areas house, the livelier they will become. This will attract more development, building both the peak and off-peak ridership base to make greater use of commuter rail’s significant untapped passenger capacity.
New Fare Collection and Tap to Ride Technology
In 2017, the MBTA began its Automated Fare Collection 2.0 (AFC 2.0) project, designed to modernize fare payment and collection across its system. While the project has faced delays, the recent introduction of contactless card and phone payment options for single rides marks a significant milestone. These “Tap to Ride” payment methods make it faster and easier to pay by simply tapping a credit card or mobile phone. The new technology will also make it easier to vary prices for riders making trips that involve transfers between commuter rail, rapid transit, and buses.
A key feature of AFC 2.0 and other fare technology projects is the enhanced ability to enforce fare collection, particularly on the commuter rail. Station validator gates will be installed on all commuter rail platforms. Riders will be able to use a fare card, a web app, mobile phone payment systems, or contactless credit card. Riders will tap before they board and then tap out at their final destination, allowing for more accurate fare collection for travel between different zones.
North Station began piloting the technology in 2022. Implementation at South Station is now in progress; Back Bay and Ruggles will also receive gates in the next six months. These validators will be integrated with the new contactless payment system, making enforcement more consistent, while providing flexibility for passengers. By reducing fare evasion through stricter enforcement, the MBTA aims to recapture lost revenue, which could help offset the cost of future fare reductions and improve the system’s finances.
Also named Fare Transformation and Charlie, the MBTA is in the process of testing different fare technologies to promote more seamless payment and efficient boarding. Future goals include a more integrated payment network that works across all modes.
Ultimately, these strategies represent a critical step forward for the MBTA’s commuter rail network, offering both improved convenience for riders and a more robust framework for ensuring that fares are collected fairly and effectively.
III. Regional Rail and Equitable Development
Regional Rail’s value proposition is heavily rooted in its ability to generate more equitable growth. The concentration of economic activity in the core Boston area has put extreme pressure on low- and moderate-income residents in these communities. At the same time, concentrated growth has increased agglomeration forces, siphoning investment and economic activity away from other regions of the state.14 While transit infrastructure has contributed to unbalanced economic development, it has the same power to help Massachusetts build more geographically balanced growth in the future.
Toward this end, policymakers must pay particular attention to how Regional Rail is perceived by Gateway City residents and their leaders. With the cost-of-living steadily rising, Gateway City residents are extremely fearful of any investments, public or private, that could lead to displacement. Concerns about the impact of Regional Rail are not unwarranted. TOD has often led to significant gentrification pressures because of the considerable value that households place on reliable public transit.15 While there are many ways that planners can anticipate and mitigate the risk of displacement, ensuring that those living in communities served by Regional Rail can afford to regularly utilize the service is a crucial first step to generate equitable economic developments benefits.
The analysis in this section looks at whether commuter rail is currently affordable for residents of Gateway Cities throughout the state, and the extent to which the new Income-Eligible Reduced Fare (IERF) program has expanded access to the service.
How Affordable is Commuter Rail for Gateway City Residents?
If rail travel was the only transportation expense for Gateway City residents, our estimates show most could afford to purchase a monthly pass under the commonly accepted standard that transportation costs should consume no more than 15 percent of a household’s gross income. Currently, the most expensive rail pass for Gateway City residents is $378/month. This is just under 15 percent of income for a full-time worker earning minimum wage in Massachusetts.
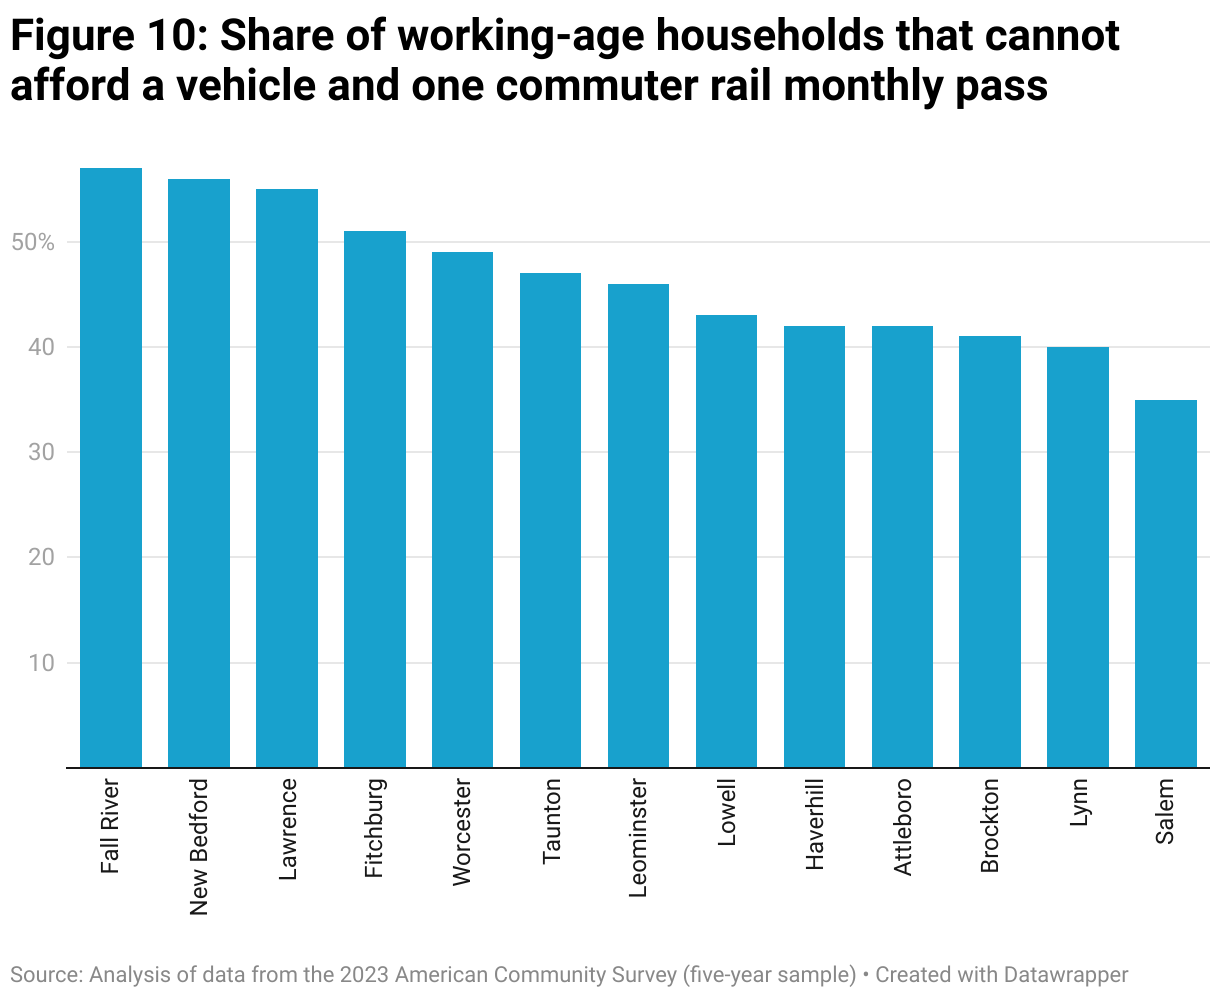
However, expending 15 percent of income on a rail pass is not practical for many residents living in these communities. While there have been considerable improvements to Regional Transit Authority bus schedules, Gateway Cities are not nearly as well-served by local public transit as those living in the Boston core. As such, most households still require at least one vehicle to meet basic needs. The combined cost of vehicle ownership and a monthly pass is well out of reach for more than half of the residents of Fall River and New Bedford. In all of the other Gateway Cities, one vehicle and a monthly pass is cost-prohibitive for one-third or more of residents (Figure 10).16
Many experts also question the validity of the 15-percent standard. This is the average amount that US households spend on combined transportation costs, but there is no evidence that it is an amount that Gateway City residents can comfortably afford.17In Massachusetts, where everything is more expensive, especially housing, utilizing 15 percent of income for transportation may involve considerable sacrifices. Lower-income families often respond to transportation costs by making fewer trips; using slower, less convenient, and sometimes dangerous travel options; or spending more than they can reasonably afford at the cost of other vital expenditures, such nutrition, housing, education, or health care.18
How Affordable is Commuter Rail for Gateway City Residents with the IERF?
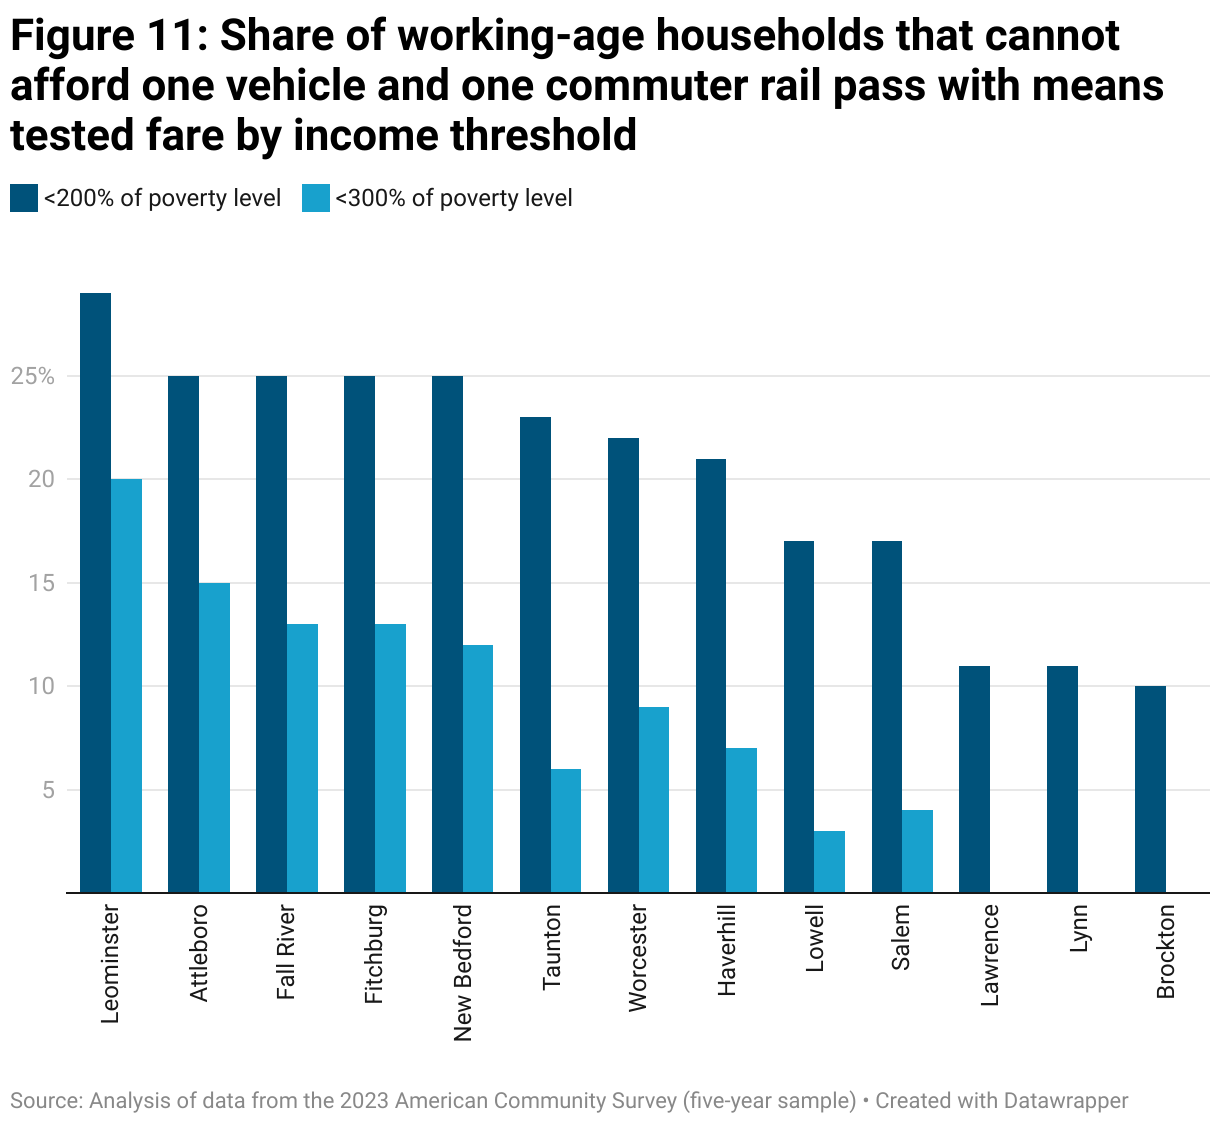
IERF lowers fares by half for residents with household income below 200 percent of the federal poverty level. For a family of four, this threshold is about $64,000 annually. The new discounted fare has significantly reduced the share of Gateway City households that cannot afford a monthly pass plus one vehicle. However, this modest transportation budget is still out of reach for more than one-quarter of residents in Attleboro, Fall River, Fitchburg, Leominster, and New Bedford. In eight Gateway Cities, a car and a monthly pass is unaffordable for over 20 percent of residents (Figure 11).
Raising the ceiling to 300 percent of the FPL—the threshold that Massachusetts uses to determine eligibility for other programs, such as MassHealth Family Assistance—would make commuter rail more affordable for almost all residents of Gateway Cities near Boston and a large majority of residents in Gateway Cities at a greater distance.
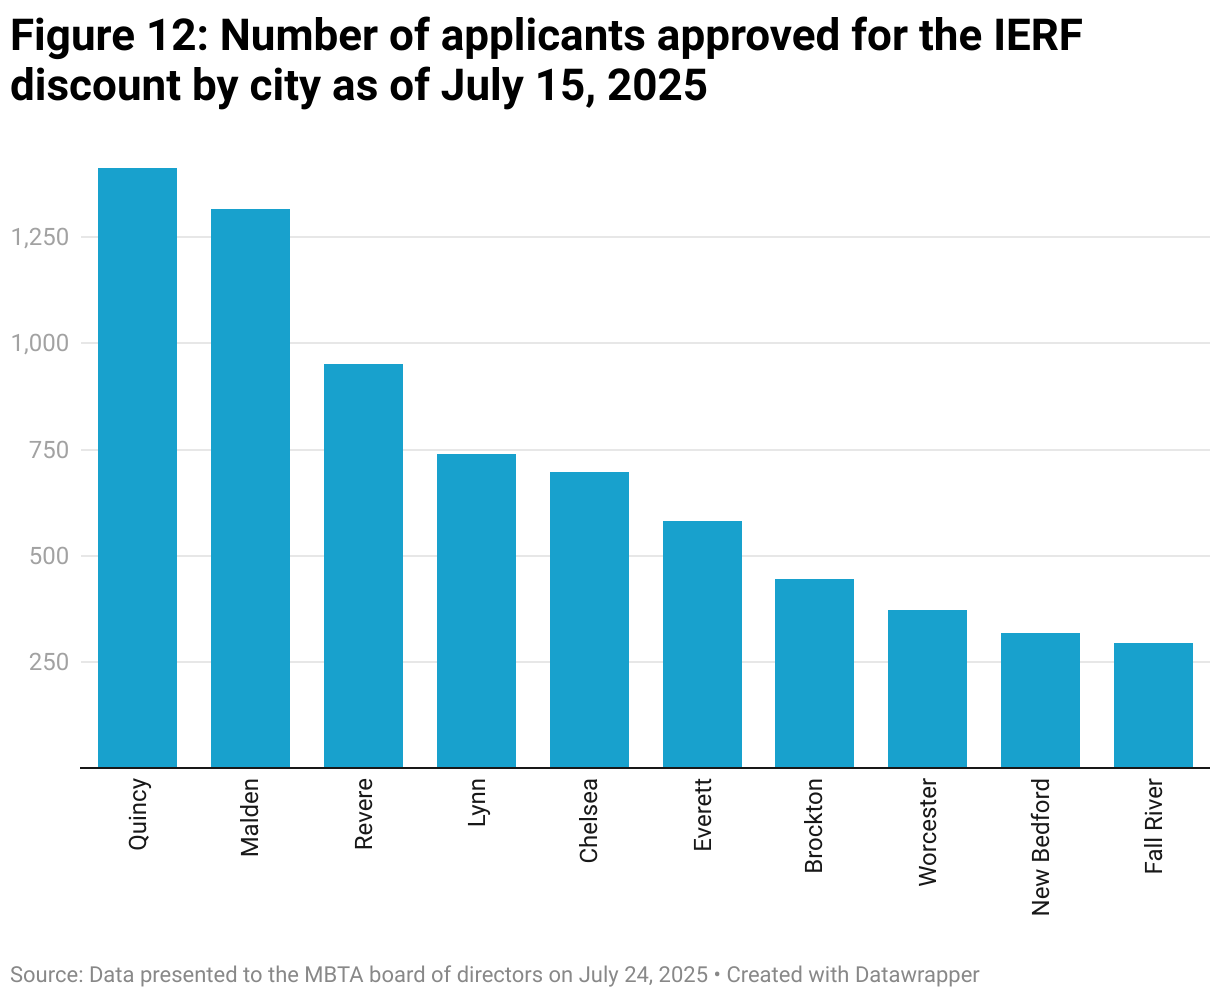
However, there is still considerable concern that a 50-percent discount on the more expensive outer zone fares is insufficient for those with very low income. Data on IERF uptake for the first nine months of the program provide an early indication that commuter rail travel remains cost-prohibitive for many low-income Gateway City residents. So far, more than 30,000 MBTA riders have enrolled in the IERF.19 But over two-thirds of participants live in the core service area (Boston, Brookline, Cambridge, and Somerville). Enrollment in Gateway Cities served exclusively by commuter rail has been relatively low. Attleboro, Fitchburg, Haverhill, Lawrence, Leominster, Lowell, and Salem are noticeably absent from the data provided by the MBTA, which indicates very limited participation in these communities to date.20 Worcester has nearly 40,000 workers with earnings below 200 percent of FPL; only 370 participate in the IERF (Figure 12).
Examples
Example 1. Household Income of $19K (Individual living in Concord with a disability and no car)
Take an individual with accessibility needs and an annual income of $19K. They have frequent medical appointments in Boston and wants to visit friends afterward. They have no car and rely solely on public transit for getting around. While they are able to utilize the RIDE paratransit service for some trips from their home, they aren’t able to utilize the resource for any trips not originating from their home. At 150% of FPL, they are qualified for low-income fares, but the lower fare is still too expensive. At more than $2K a year, the commuter rail pass would consume nearly 12% of the individual’s yearly income.
| Annual Income | City and consumer rail zone | % of FPL | Qualifies for low-income fares? | Annual cost of consumer rail | % income spent on travel |
| $19K | Concord, Zone 5 | 133% | Yes | $1,764 | 9.3% |
Example 2. Household Income of $65K (Individual living in Brockton with 2 children and a hybrid job)
Now, take a single parent of two children who makes $65K annually. They formerly lived in Mattapan (Zone 1A) but were pushed out by rising housing costs into Brockton (Zone 4). They have a car that they use to get around Brockton but work a hybrid job, only commuting into the city three times a week. At 250% of FPL, they miss the threshold for low-income fares and have to pay the full fare. At the standard rate, the commuter rail pass would cost more than $3K a year. Even with the 5-Day Flex Pass and a 10% discount, using the commuter rail would still cost roughly $2,720.
| Annual Income | City and consumer rail zone | % of FPL | Qualifies for low-income fares? | Annual cost of consumer rail | Cost of consumer rail with 5-Day Flex Pass | Cost of travel (consumer rail + car) | % income spent on travel |
| $65K | Brockton, Zone 4 | 250% | No | $3,252 | $2,457 | $15,540 | 24% |
Example 3. Household Income of $94K (Family of four living in Worcester with a car)
Finally, take a family of four with a household income of $94K. They live in Worcester and have a family car they utilize for commuting, running errands, getting to school, and other needs. They are interested in making the shift toward commuter rail for trips into the city for work and school while continuing to use their car for errands and leisure. With a $94K salary putting them at 300% of FPL, this family does not qualify for low-income fares. In Zone 8, a yearly commuter rail pass would cost more than $4K. On top of car expenses, this family is now using more than 15% of their salary solely for transportation. To allow greater flexibility in their schedules, they would likely opt to continue using their car over a getting a commuter rail pass meaning these potential commuter rail riders would be lost due to the the cost of fares.
| Annual Income | City and consumer rail zone | % of FPL | Qualifies for low-income fares? | Annual cost of consumer rail | Cost of travel (consumer rail + car) | % of income spent on travel |
| $94K | Worcester, Zone 8 | 300% | No | $4,536 | $16,824 | 18% |
IV. Innovative Fare Policies to Maximize the Potential of Regional Rail
MBTA commuter rail has significant untapped capacity to carry more passengers, increasing labor productivity and fueling more balanced regional economic development. Taking advantage of new fare collection technology to vary and optimize fares is the most immediate way to tap this latent potential. Toward this end, we offer three recommendations grounded in our analysis of the data:
- Cut off-peak and reverse-commute fares by half. The commuter rail system’s significant excess capacity is an overlooked economic asset. Off-peak trains travel at just 13 percent of maximum passenger capacity, while less than 8 percent of seats are occupied on peak-period trains moving in the reverse direction. Lowering prices to fill more of these seats will not lead to overcrowded trains, and it will not increase operating costs in any material way. While reducing fares for off-peak and reverse-commute riders will result in significant lost revenue in the near term, the benefits should produce a net positive return for the state over the long term.
Our estimates suggest a 50-percent reduction in fares for reverse commuters will increase weekday ridership by over 900 passengers (230,000 additional trips annually) at a cost of just $4.5 million.21A 50-percent discount for riders traveling during off-peak periods will be significantly more expensive, both because there are currently far more off-peak riders and some peak-period riders will shift to off-peak trains to reduce their travel costs. However, studies consistently find that off-peak riders are more sensitive to prices than those commuting during rush hour.22 This means a 50 percent discount will draw significantly more new passengers. According to our model, a 50-percent discount would generate roughly 8,000 new trips daily (nearly 2 million annually) at a cost of $16 million.23
Implementing a 50 percent reduced fare for both reverse commuters and off-peak riders will increase weekday ridership by approximately 9,000 passengers daily, or nearly 10 percent growth. The $20 million cost is equivalent to approximately 4 percent of operating costs. Over the long term, these lower fares will lead to even more new riders to offset lost revenue from current riders. The MBTA has first-hand evidence of this with the $10 Weekend Pass. During the initial six-month pilot in 2018, sales grew by just 5 percent.24 But in 2024, the MBTA reported 40 percent growth in Weekend Pass sales compared to the summer of 2023.25
Transportation experts have recommended reducing off-peak fares to between 30 and 60 percent off peak fares to maximize ridership and revenue.26 A 50-percent fare reduction is within this range, and it is a clear and transparent figure for riders. The MBTA could likely use additional fare revenue from the validator gates to cover near-term revenue losses from these fare reductions. - Provide deeper discounts for low-income riders and vary prices with earnings to mitigate the cliff effect. The MBTA has taken a crucial first step forward with the Income-Eligible Reduced Fare program. However, as currently constituted, this discount is insufficient to make commuter rail affordable for all residents. At nearly $200 per month for the longest commutes, discounted passes are still too expensive to give lower-wage Gateway City workers employment opportunities in Boston.
The MBTA can build on the IERF and develop a means-tested fare program built specifically to boost employment and earnings. This program would make commuter rail affordable for low-wage workers traveling multiple times per week. And when workers are able to take advantage of the discounted fare to find employment and increase their earnings, the price would increase, but not so much as to negate all of the economic benefit to the individual. Leaders in Massachusetts have been conscientiously advancing policies to reduce this type of “cliff effect,” so that public benefits do not abruptly end when recipients successfully move up the economic ladder. Given the outsized impact transportation policies can have on employment outcomes, they should align with this emerging best-practice.27
In contrast to reverse-commute fares, off-peak fares, and the IERF as currently structured, a means-tested fare focused on employment should result in a net financial gain for commuter rail. These workers are not using the system today because it does not make financial sense. With commuter rail’s excess capacity even at peak periods, the marginal cost to carry these additional riders will be extremely low. - Partner with property owners to better understand how transit-oriented developments can build ridership, and work with them to devise effective strategies to market Regional Rail. The MBTA has a very strong business interest in private development that occurs within walking distance of its stations. While Gateway City downtowns have lost office workers post-COVID, many are experiencing a residential building boom. These communities have produced multifamily housing at historic levels over the past two years. Much of this new housing is located near commuter rail stations, and there are many more projects fully permitted for development.28 With MBTA Communities zoning now in place, suburbs should also see a wave of new multifamily buildings in close proximity to the stations.
The MBTA’s real estate team should survey and hold focus groups with residents of these projects to develop a more granular view of how these projects are contributing to ridership. Downtown housing is relatively new to most Gateway Cities and there is much to learn about the occupants of these properties and their travel patterns. The same will be true for those living in new suburban neighborhoods formed by MBTA Communities. Collecting information about these residents can help local planners and the MBTA refine land use and land disposition policies to maximize ridership from TOD projects.
This information can also help inform public-private marketing partnerships. Given the limited supply of housing in Massachusetts, new housing projects generally lease up quickly and developers have little incentive to ensure that these apartments and condos go to those who plan to make full use of the transit. Similarly, those who work in office buildings near transit may have very little reason to try the train, especially in Gateway City downtowns, where congestion is relatively limited and parking is fairly plentiful. The MBTA should make an effort to build its ridership base by partnering with real estate developers and employers to market public transit to prospective renters/buyers and new hires. For instance, in exchange for private-sector support promoting the public transit service, the MBTA could provide free trial passes to new riders for a limited time.
About the MassINC Policy Center
The MassINC Policy Center works to foster civic vitality and promote inclusive economic opportunity across Massachusetts. Through nonpartisan research, reporting, analysis, and civic engagement, the Center equips residents with the knowledge needed to understand policy decisions, inform public debate, and hold government accountable. Founded in 1996 by a group of civic and business leaders, MassINC emerged from a shared belief that the Commonwealth needed more accurate, comprehensive, and unbiased information to guide effective policymaking.
About TransitMatters
TransitMatters advances people-focused and data-driven solutions to advocate for better public transportation and mobility that provides access and opportunities for everyone across the Commonwealth, addresses climate change and inequality, and strengthens our economy. We envision a sustainable, equitable, and reliable public transportation system that is accessible and affordable to everyone in Greater Boston and across the Commonwealth by advancing proven best practices as well as high-impact, cost-effective initiatives.
Footnotes
- Positive Train Control is primarily intended to prevent collision between trains and curb speeding. However, it also allows trains to run closer together through certain segments of the system. Phase I was completed in 2020 and Phase II was accomplished in 2024. ↩︎
- Daniel Vock. “Boston-area commuter rail bounces back, while other agencies lag.” Route Fifty (June 3, 2024). ↩︎
- Paul Lewis and Leo Shirky. “The Future of Commuter Rail in North America.” TCRP Research Report 254 (2025). ↩︎
- See: https://www.mbta.com/performance-metrics/the-rider-census.
↩︎ - For consistency between the two periods, 60 percent of AMI is the cutoff for low-income in these comparisons. In 2023, the MBTA increased the low-income threshold to 80 percent below of AMI. Therefore, more recent MBTA reports show 68 percent of commuter rail passengers are low-income (as opposed to 40 percent with the 60 percent AMI standard). ↩︎
- Katie Calandriello and others. “Transit-Supportive Density in Greater Boston.” (Boston, MA: Boston Indicators, 2025). ↩︎
- See: https://www.mbta.com/performance-metrics/the-rider-census ↩︎
- Note that this estimation approach differs slightly from the MBTA’s definition of interzone trips—those that are entirely outside of Zone 1A. Those that meet this definition receive the lower Interzone Fare. ↩︎
- In addition to leaving us without data for terminal stations, this approach misses a significant number of riders when another city lies between Boston and a Gateway City on the line. Most notably, we cannot observe travel between Chelsea and Lynn and Salem, and Quincy and Braintree and Brockton. In this regard, the increase in reverse commutes for Brockton and Salem reported previously likely includes a significant number of passengers who are actually interzone commuters. ↩︎
- Note that this estimation approach differs slightly from the MBTA’s definition of interzone trips—those that are entirely outside of Zone 1A. Those that meet this definition receive the lower Interzone Fare. ↩︎
- See: “MBTA Commuter Rail Fare Study.” (Boston, MA: Massachusetts Department of Transportation, March 2020). ↩︎
- In practice, the system utilizes a variety of trainsets based on both available rollingstock and varying levels of ridership. However, with the new procurement of bilevel coaches, it will be possible to move at least this many passengers on each run if demand calls for it. ↩︎
- https://www2.bostonmpo.org/data-catalog/traffic-volumes-i-93-southeast-expressway; https://www.roadsbridges.com/transportation-management/article/10582056/boston-unclogs-its-central-artery ↩︎
- For more on these economic forces, see: Dan Hodge and Ben Forman. “The Promise and Potential of Transformative Transit-Oriented Development in Gateway Cities. (Boston, MA: MassINC, 2018). ↩︎
- Jared Schachner. “Neighborhood Economic Change in an Era of Metropolitan Divergence.” Urban Affairs Review 58.4 (2022); Jens Kandt and others. “How Do Major Public Transport Investments Induce Gentrification? Evidence from Consumer Data.” Transportation Research Part D: Transport and Environment 142 (2025). ↩︎
- This assumes vehicle costs are $334 per month, which includes sales tax, registration costs, gas, and annual maintenance costs, drawing on state data provided by Insurance.com at https://www.insurance.com/total-cost-of-ownership. This total is slightly below the Victoria Transportation Institute’s estimate for total vehicle ownership costs for households in the bottom quintile nationally. See: https://www.vtpi.org/affordability.pdf ↩︎
- https://www.bts.gov/data-spotlight/household-cost-transportation-it-affordable ↩︎
- https://www.vtpi.org/affordability.pdf ↩︎
- “Income-Eligible Reduced Fares Program Update.” Presentation to the Board of Directors (July 24, 2025). https://cdn.mbta.com/sites/default/files/2025-07/9.%20IERF%20Board%20Deck%20_%20July%202025.pdf ↩︎
- Lack of application for residents of these communities is somewhat surprising given that Lowell, Salem, and Lawrence are among the top destinations for IERF riders. However, this travel pattern reinforces evidence that reverse commute ridership is growing with progress toward a regional rail operating model. ↩︎
- This estimate assumes a price elasticity of -0.2. We use $4.87 as the variable revenue per passenger drawing from the MBTA’s 2023 FTA report. We define reverse commuters as those departing from Zone 1A stations on trains moving outward from Boston before 12 pm. We also assume that all riders make a return trip. In this sense, the cost-impact of these estimates are conservative; some riders will inevitably make one-way trips or return trips via another mode. This estimate is also conservative because it is based on passenger counts conducted Tuesday through Thursday, and it assumes 250 workdays per year with these relatively high passenger volumes. ↩︎
- Ian Parry and Kenneth Small. “Should Urban Transit Subsidies Be Reduced?” American Economic Review 99.3 (2009); Christoph Thommen and others. “Price Versus Commitment: Managing the Demand for Off-Peak Train Tickets in a Field Experiment.” Transportation Research Part A: Policy and Practice 174 (2023). ↩︎
- This estimate assumes a price elasticity of -0.4. We use $4.87 as the variable revenue per passenger drawing from the MBTA’s 2023 FTA report. Peak period trains are those traveling toward Boston between 7 and 9 am and those traveling outward from Boston between 4 and 7 pm. We also assume that all riders make a return trip. In this sense, the cost-impact of these estimates are conservative; some riders will inevitably make one-way trips or return trips via another mode. This estimate is also conservative because it is based on passenger counts conducted Tuesday through Thursday, and it assumes 250 workdays per year with these relatively high passenger volumes. ↩︎
- Bruce Mohl. “T board mad weekend commuter rail pass is ending.” CommonWealth (December 10, 2018). ↩︎
- https://www.mbta.com/news/2024-09-10/commuter-rail-sees-major-increase-weekend-pass-sales-summer ↩︎
- Todd Litman. “Transit Price Elasticities and Cross-Elasticities.” Journal of Public Transportation 7.2 (2004); “Transit Pricing and Fares.” Traveler Response to Transportation System Changes Handbook, Third Edition (Washington, DC: The National Academies Press, 2004). ↩︎
- See: https://economicpathwaysma.org/cliff-effect ↩︎
- Elise Rapoza and others. “2025 Gateway Cities Housing Monitor.” (Boston, MA: MassINC, 2025). ↩︎