Housing production surges, but momentum may not be sustainable.
To bring housing costs under control, Gateway Cities can’t just build a little more—they need to build fast enough and at a large enough scale to get ahead of both today’s pent-up demand and tomorrow’s growth. The inaugural Gateway Cities Housing Monitor estimated that this means roughly doubling the pace of new housing production between 2022 and 2032 compared to the previous decade. This chapter examines how close cities are to meeting that goal, how different types of unit creation contribute to overall growth, and whether the added supply has been sufficient to lift vacancy rates to healthier levels. Ultimately, it is these vacancy rates that shift market power—giving renters and buyers more choice and leverage and encouraging property owners to compete on price.
Key Findings
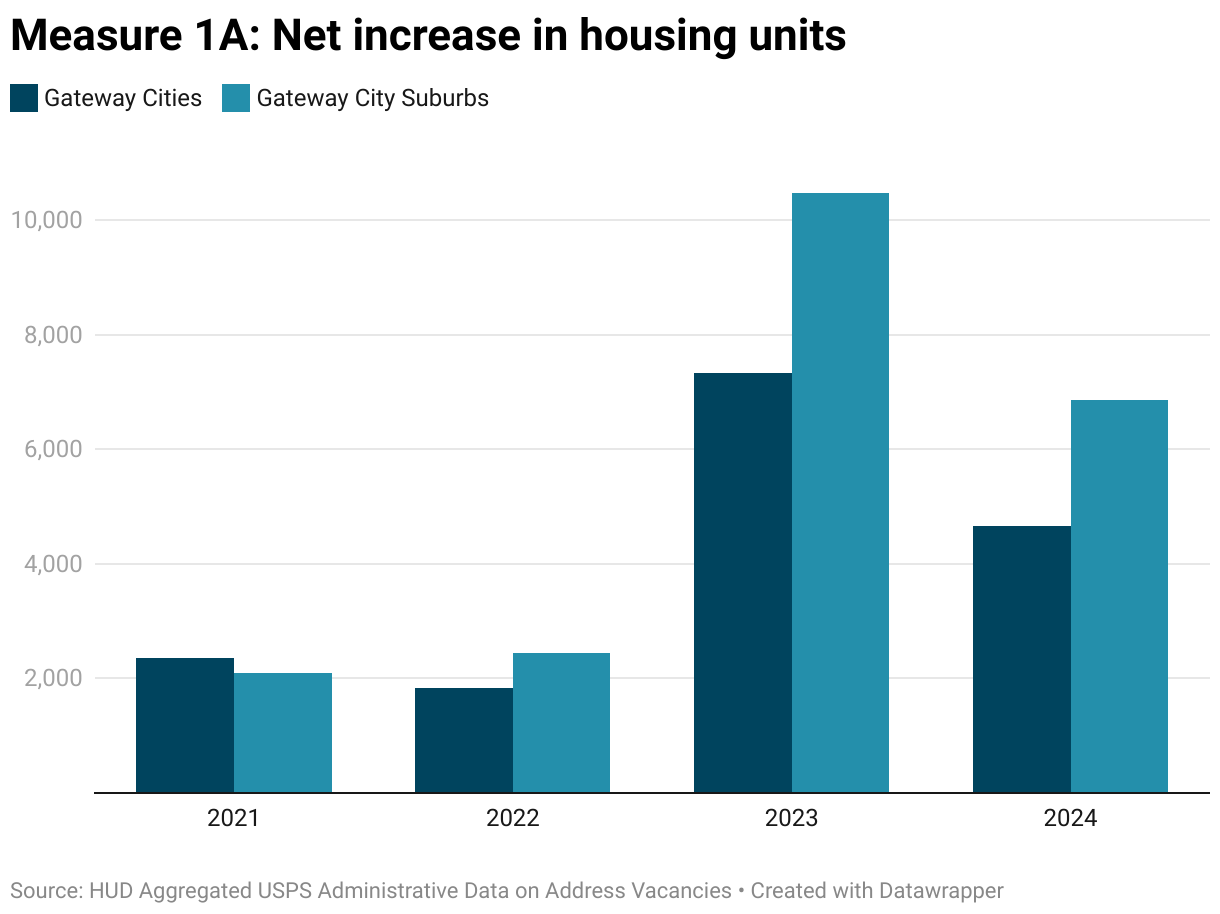
Housing production surges in Gateway Cities and their suburbs. Gateway Cities added over 7,300 housing units in 2023, up significantly from 1,800 in 2021 and 2,300 in 2022. Production remained strong in 2024, with just under 4,700 units added. Meanwhile, Gateway City suburbs added nearly 10,500 units in 2023, up from just 2,500 in 2022. Production likewise remained strong in 2024, with over 6,800 units added. However, this momentum may be hard to sustain, given that it coincided with a large infusion of one-time funding from both federal and state sources.
Even with the recent surge in production, Gateway Cities are not building fast enough to keep pace with the 2032 housing production target. Collectively, Gateway Cities are 3,000 housing units short of the 2024 production target. However, some Gateway Cities in the Greater Boston area have exceeded their growth targets. And if population growth slows and construction continues at current levels, most Gateway Cities are on pace to stabilize prices, with the exception of those in western Massachusetts.
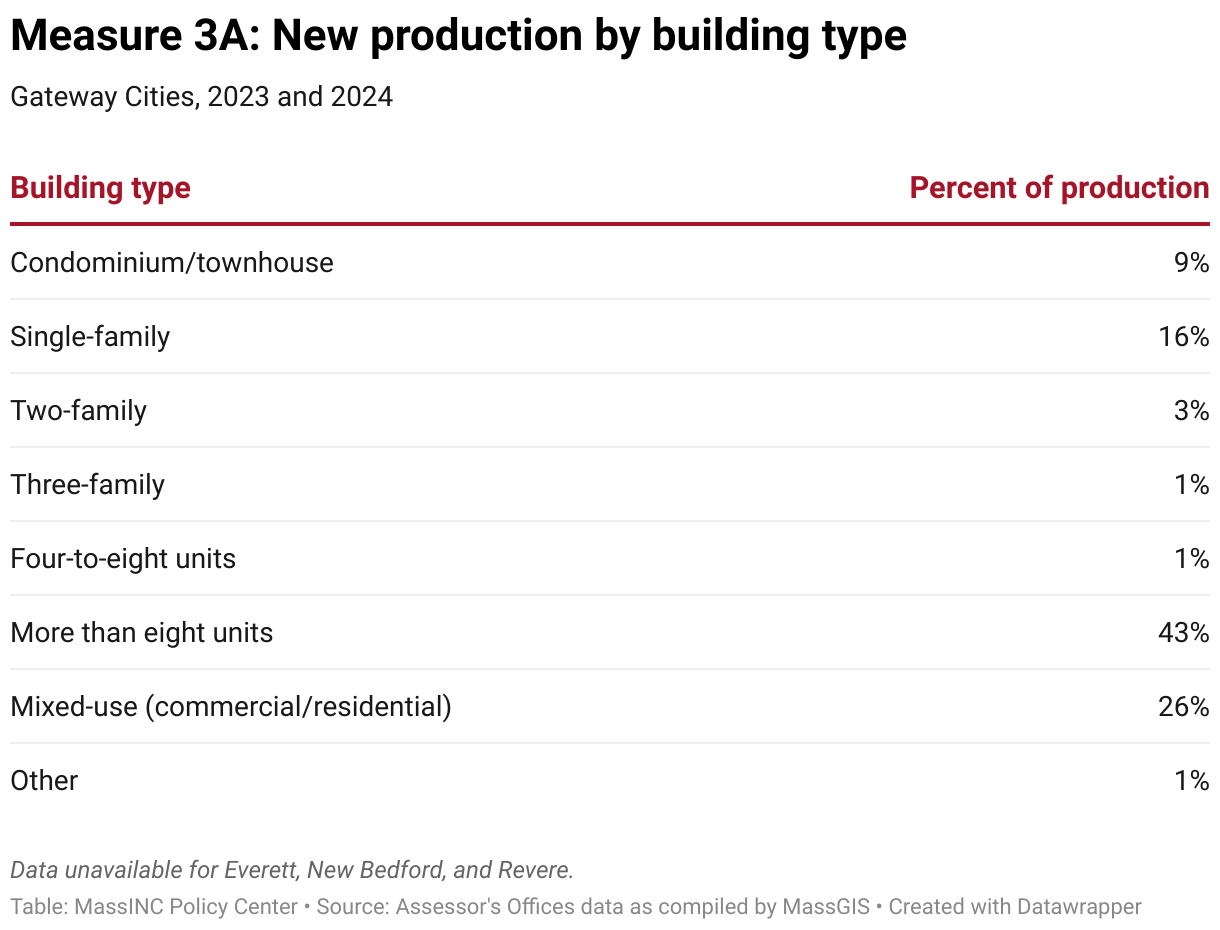
The missing middle is truly missing. While housing production has risen considerably, Gateway Cities are still struggling to build moderately-sized multifamily structures that are often naturally affordable for middle-income households. Just 5 percent of new production between 2022 and 2024 came from two- to eight-unit buildings.
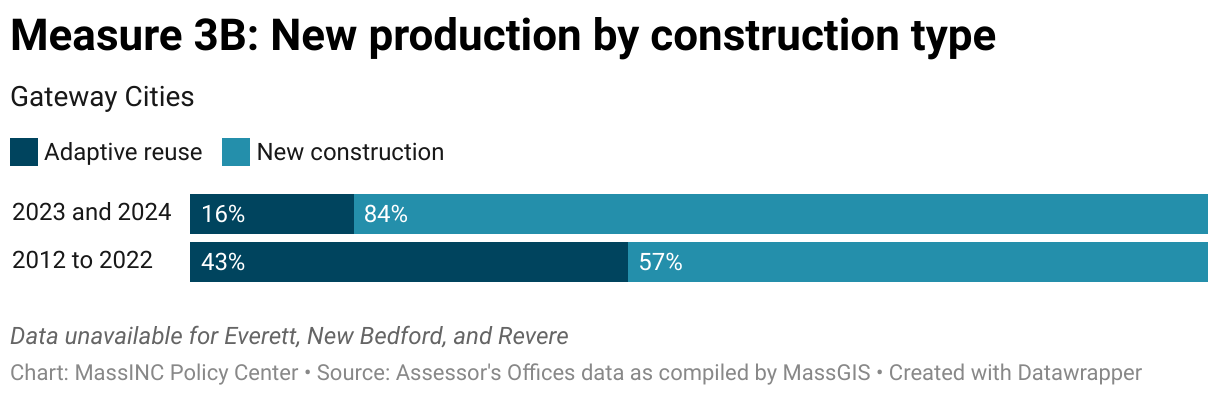
The supply of existing buildings that can be converted to housing with current financing programs may be drying up. Between 2022 and 2024, only 16 percent of housing production in Gateway Cities came from adaptive reuse of existing buildings. This was down from 43 percent over the previous decade.
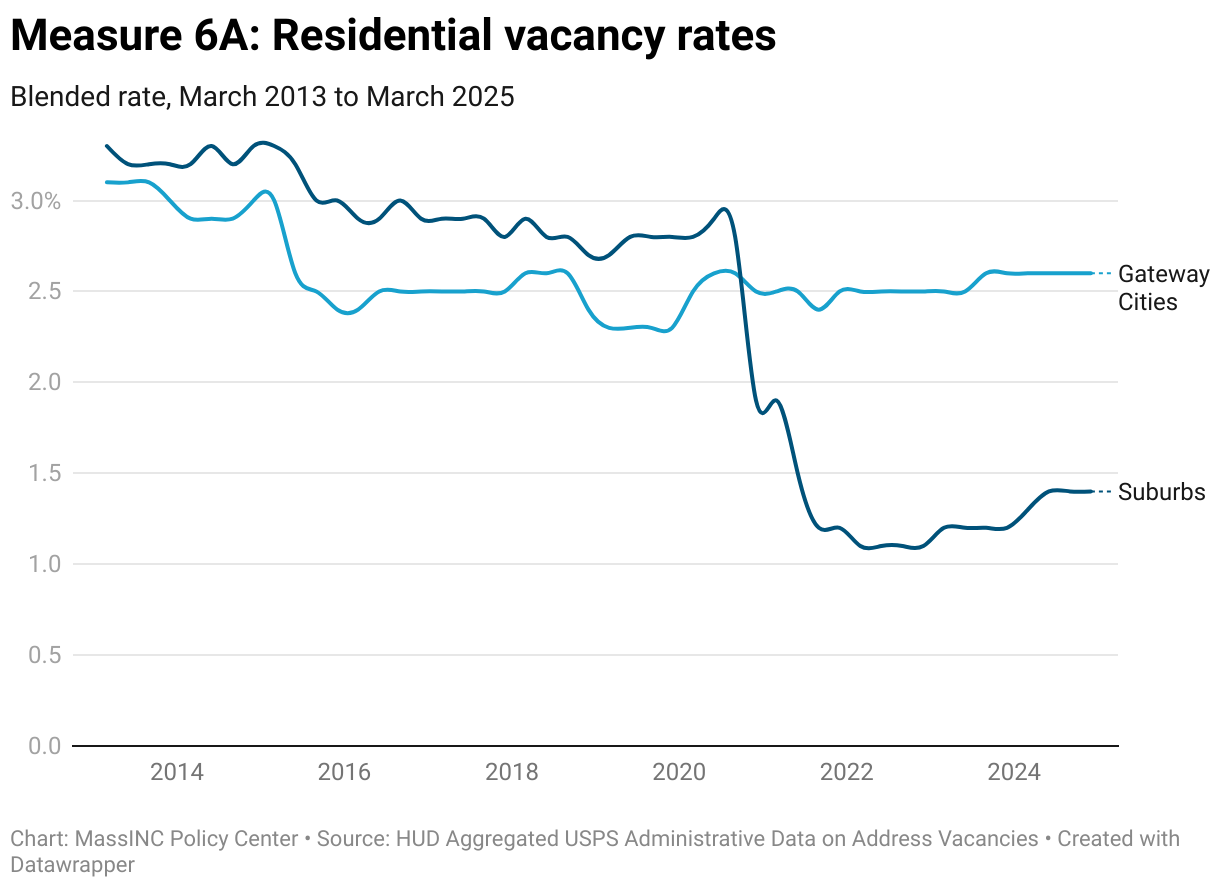
Vacancy rates remain too low to stabilize prices. Residential vacancy rates in Gateway Cities and their suburbs remain well below the 5 percent equilibrium generally considered necessary when utilizing a blended vacancy rate. Small improvements since 2023 suggest progress, but not enough to shift market power to renters and buyers.
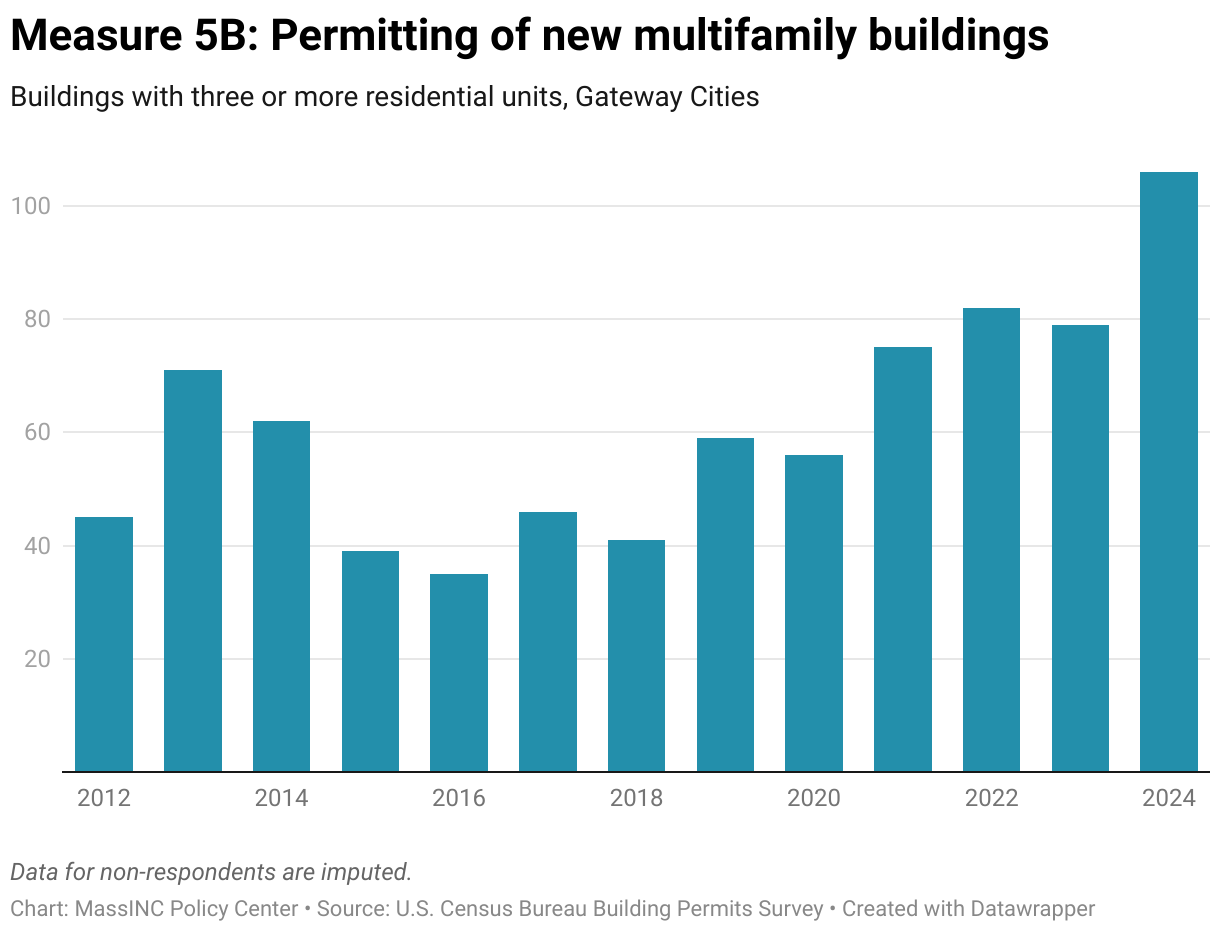
Multifamily permitting is still very strong. In 2024, Gateway Cities permitted 106 multifamily buildings—the highest figure in over a decade and more than double the 2012–2017 annual average. This points to a structural shift toward larger-scale development and a pipeline for significant housing growth in the coming years.
The sections that follow unpack the key findings with greater detail on what each measure captures, why it matters, and how Gateway Cities and their suburbs are trending. Each topic can be expanded by clicking on the dropdowns. Interactive charts allow you to hover over points for additional detail and share snapshots directly to social media. For those who want to dig deeper, the underlying datasets are available to download and explore. Together, these tools provide both a quick overview and a deeper dive into the housing production trends shaping Gateway Cities.
1. Housing Production
What does this measure?
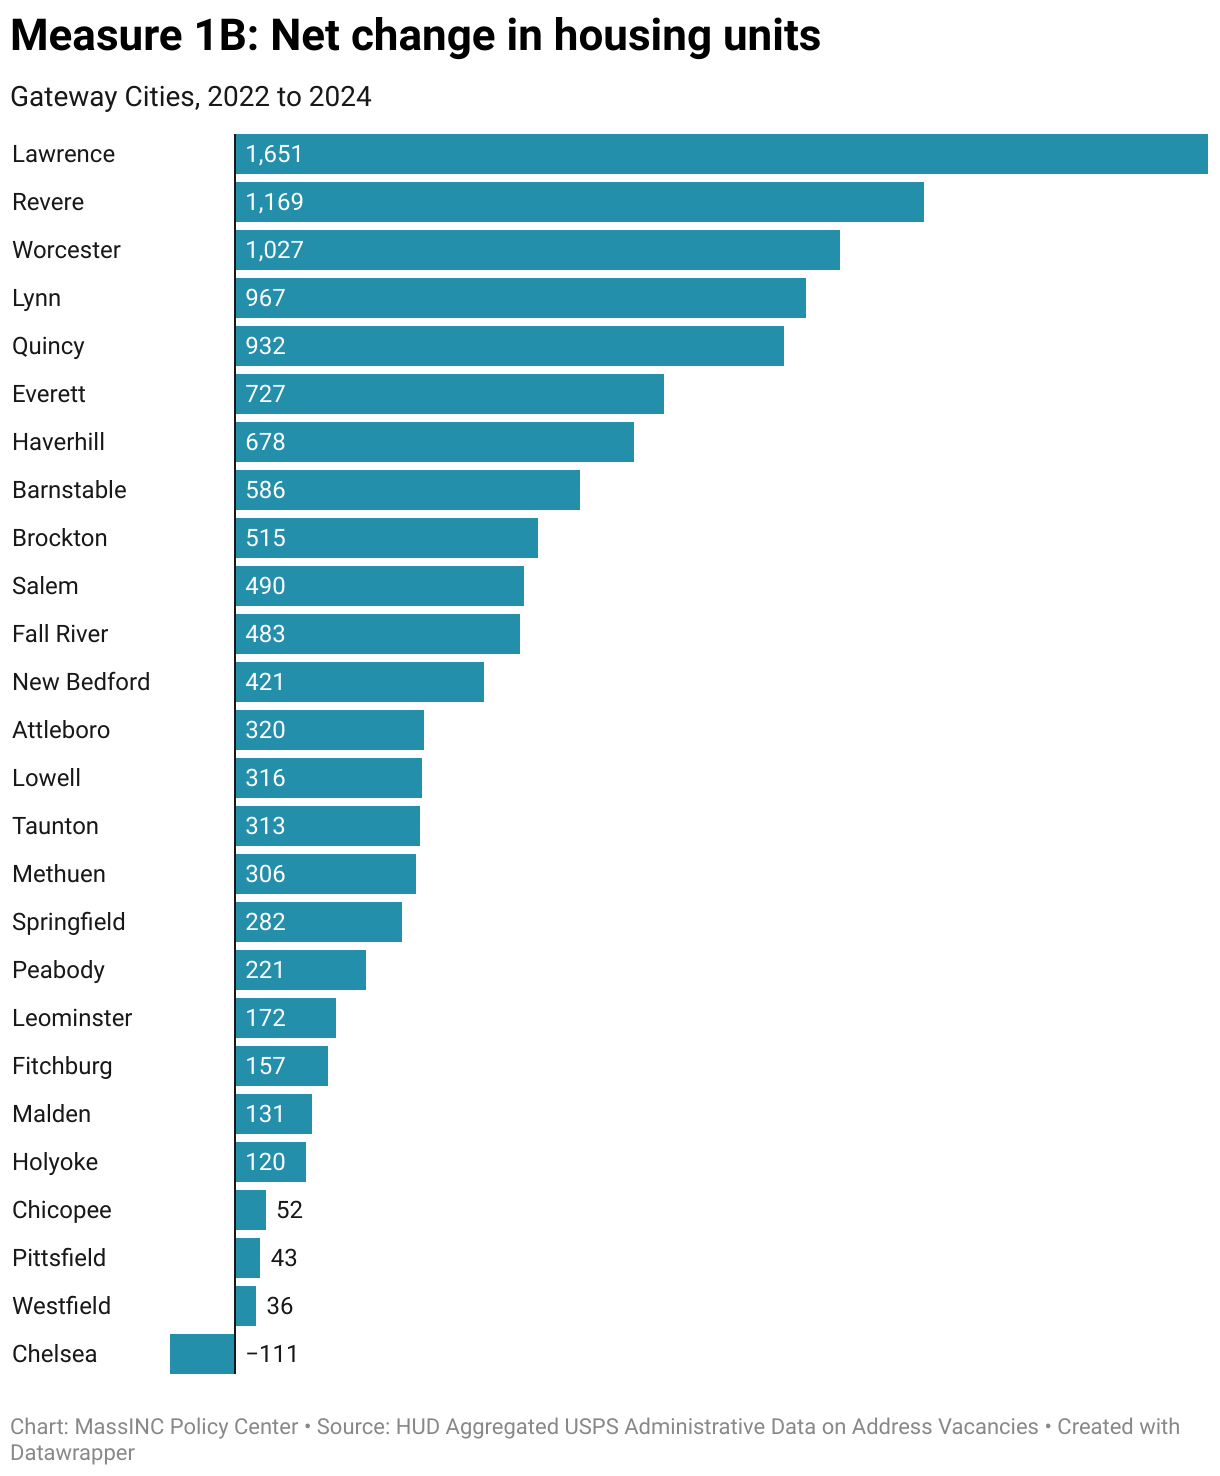
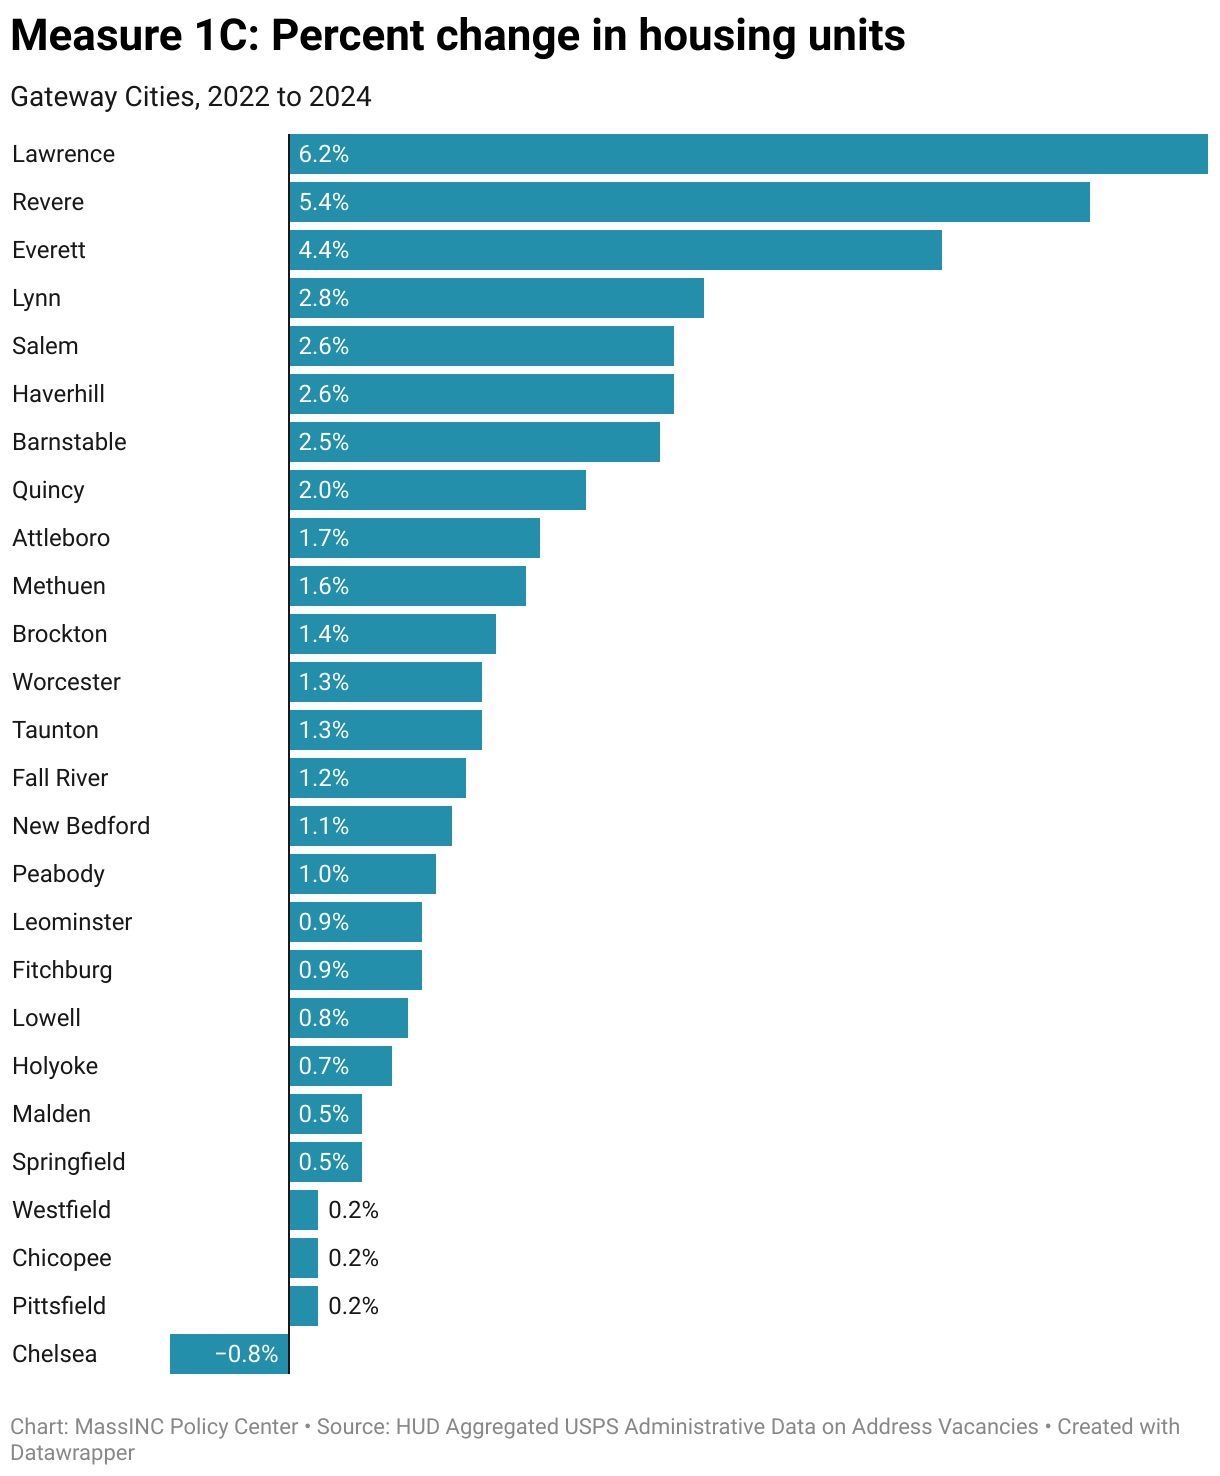
These data show the absolute net change in housing units in Gateway Cities and their suburbs from 2022 to 2024, as well as the change relative to the size of the housing stock in 2022. You can see which cities are adding the most new units and which cities are increasing their housing supply at the fastest pace.
Why is this important?
Tracking the net change in housing units shows whether Gateway Cities are producing homes at the scale needed to ease housing pressures. The inaugural Housing Monitor found that they must roughly double production compared to the prior decade to keep up with demand. Sustained production above 2021 and 2022 levels signals that recent policy and funding interventions are working, while slower gains point to the need for stronger action to prevent worsening affordability challenges.
Notes about the data
To estimate production, we track the net change in residential addresses using records from the US Postal Service (USPS) aggregated by the US Department of Housing and Urban Development (HUD). While not a perfect measure of production, these data provide a more timely indication of how the housing stock is changing than do sources such as the US Census Bureau. To calculate the number of residential addresses, we deduct “No-Stat” addresses from the total residential address count. “No-Stat” addresses include buildings that are abandoned, or under construction and not yet ready to be occupied, as well as PO boxes registered with the Move to Competitive Street Addressing program.
How are Gateway Cities and their suburbs doing?
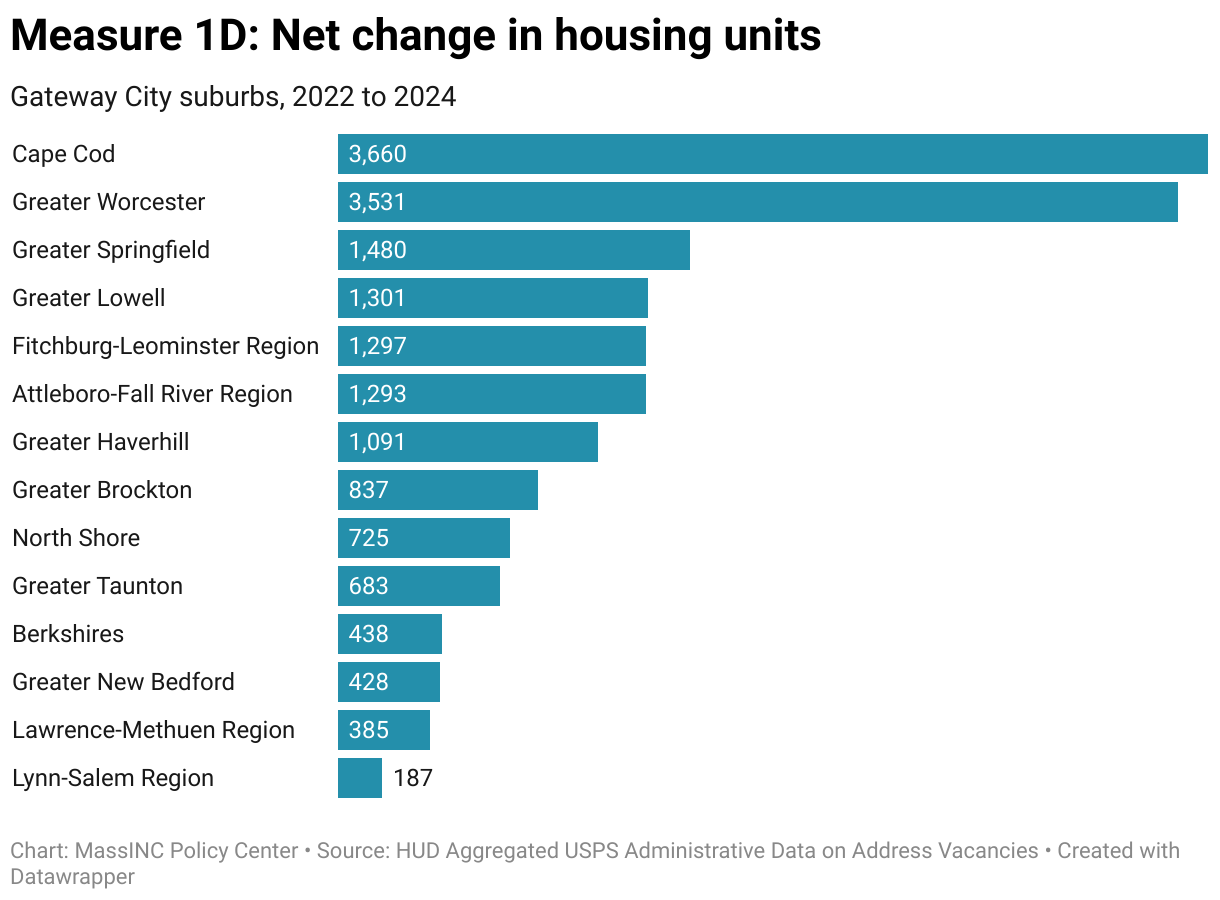
In 2023 and 2024, Gateway Cities added about 12,000 residential addresses, while their suburbs added roughly 17,300—about 5,300 more. Production surged in 2023, when Gateway Cities quadrupled output to over 7,300 new units, up from 1,800 in 2022 and 2,300 in 2021. They followed with just under 4,700 units in 2024, keeping production well above pre-2023 levels. Suburban growth was even more dramatic: Gateway City suburbs added nearly 10,500 new homes in 2023 (up from 2,500 in 2022) and over 6,800 in 2024.
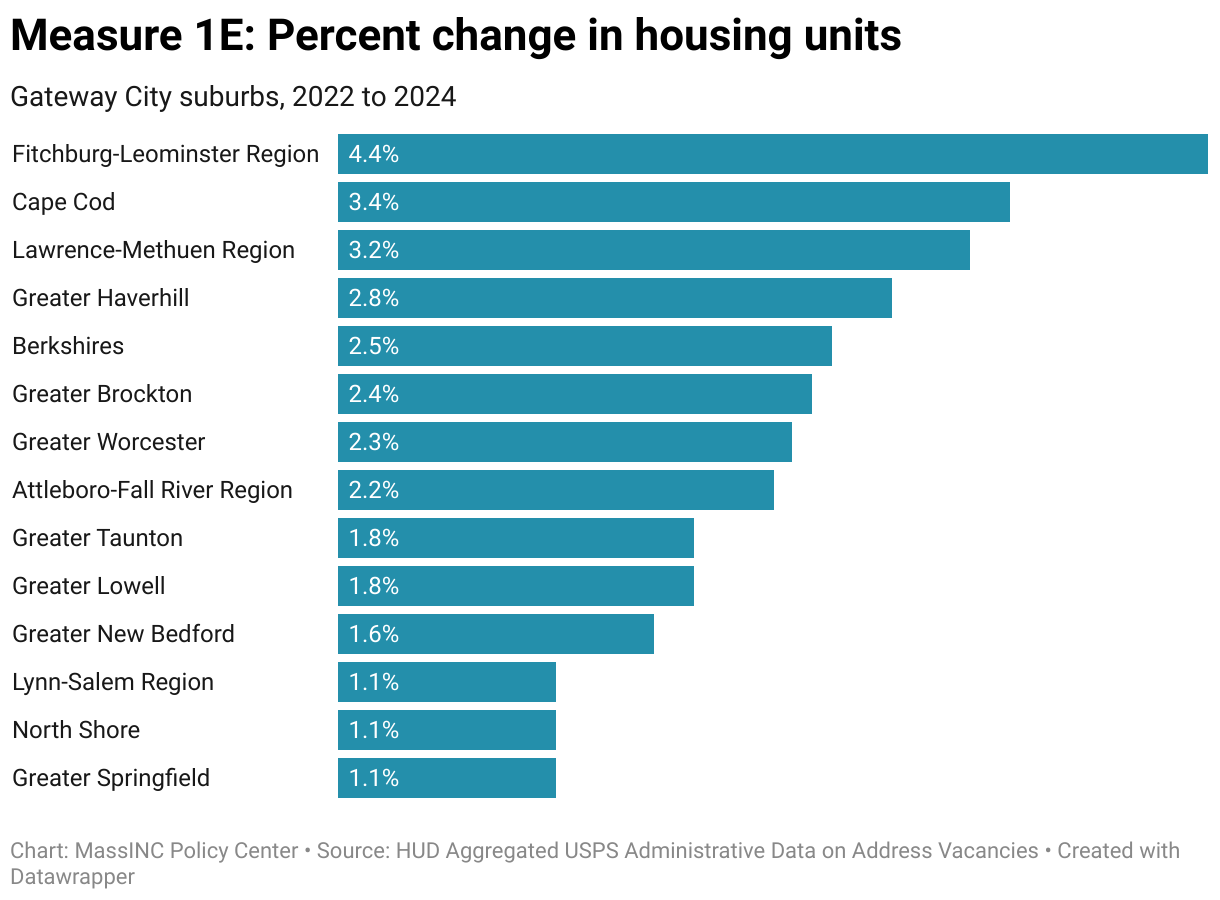
Suburbs benefit from easier development conditions—more land and fewer infill constraints—but Gateway Cities still outpaced them relative to size, adding 16 units per 1,000 homes since 2022, compared with 13 per 1,000 in the suburbs.
Among Gateway Cities, Lawrence, Revere, and Worcester added the most units on net, with each growing by more than 1,000 units. Everett takes Worcester’s spot in the top three when adjusting for size. Growth within the suburbs was concentrated in Greater Worcester and Cape Cod, which together accounted for 40 percent of new suburban production. Adjusted for size, Cape Cod and the suburbs around Fitchburg, Leominster, Lawrence, and Methuen grew the fastest.
Chelsea stands out for showing a net loss of housing units. However, this likely reflects temporary fluctuations tied to replacement or renovation activity. Assessor records indicate that Chelsea built about 70 new units in 2023 and 2024, but those gains were outweighed by units coming offline during construction, leaving the city with a short-term dip in its housing stock.
2. Progress Toward Achieving Housing Supply Goals
What does this measure?
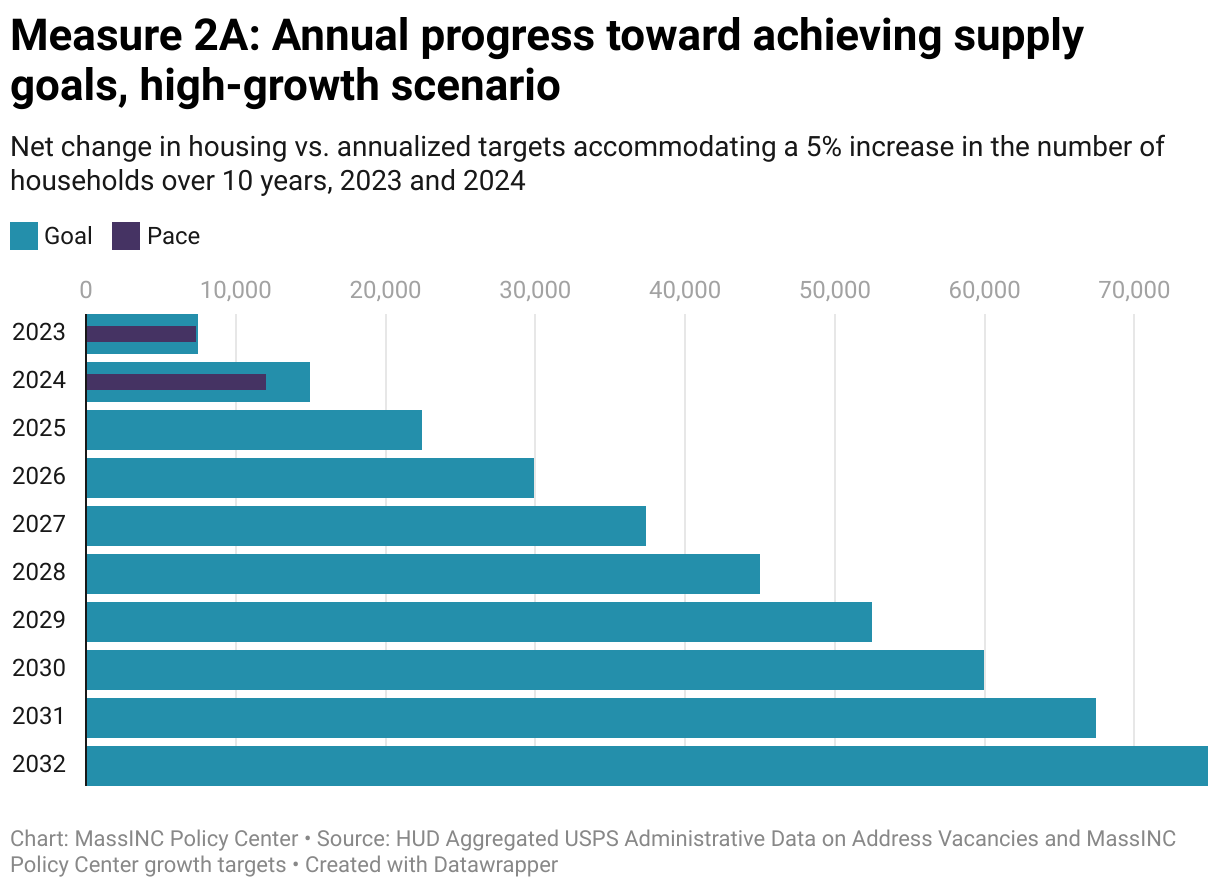
These data show how Gateway Cities and their suburbs are measuring up against the housing growth targets introduced in the inaugural Gateway Cities Housing Monitor. In 2024, the MassINC Policy Center estimated that the 26 Gateway Cities together would need to add 83,000 units to bring the housing market into balance. This target assumes 5 percent growth in the number of households (referred to here as population growth for simplicity) across Gateway Cities. This population figure was grounded in the assumption that all Gateway Cities are working to grow their populations along with their economies. It was also based on historical growth trends; the number of households in Gateway Cities increased by 8 percent over the previous 10 years.
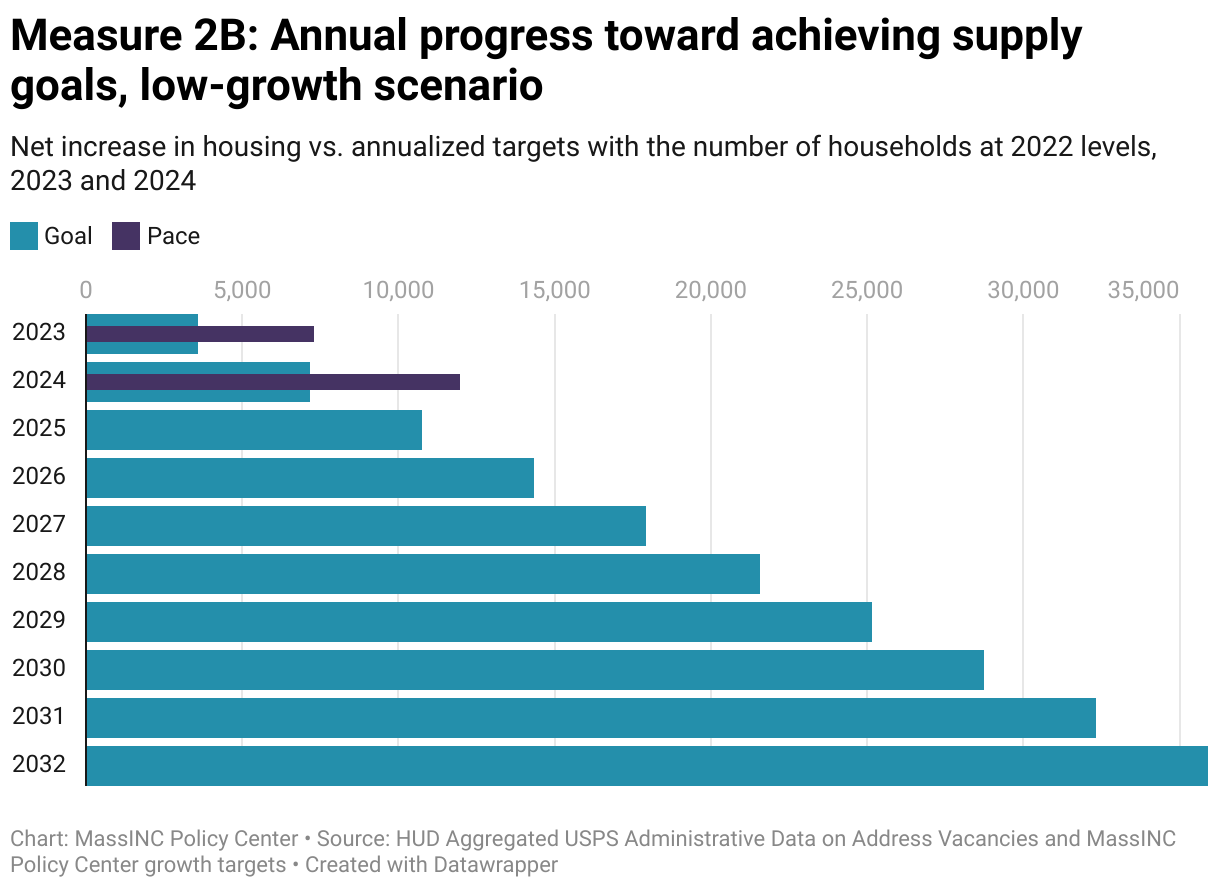
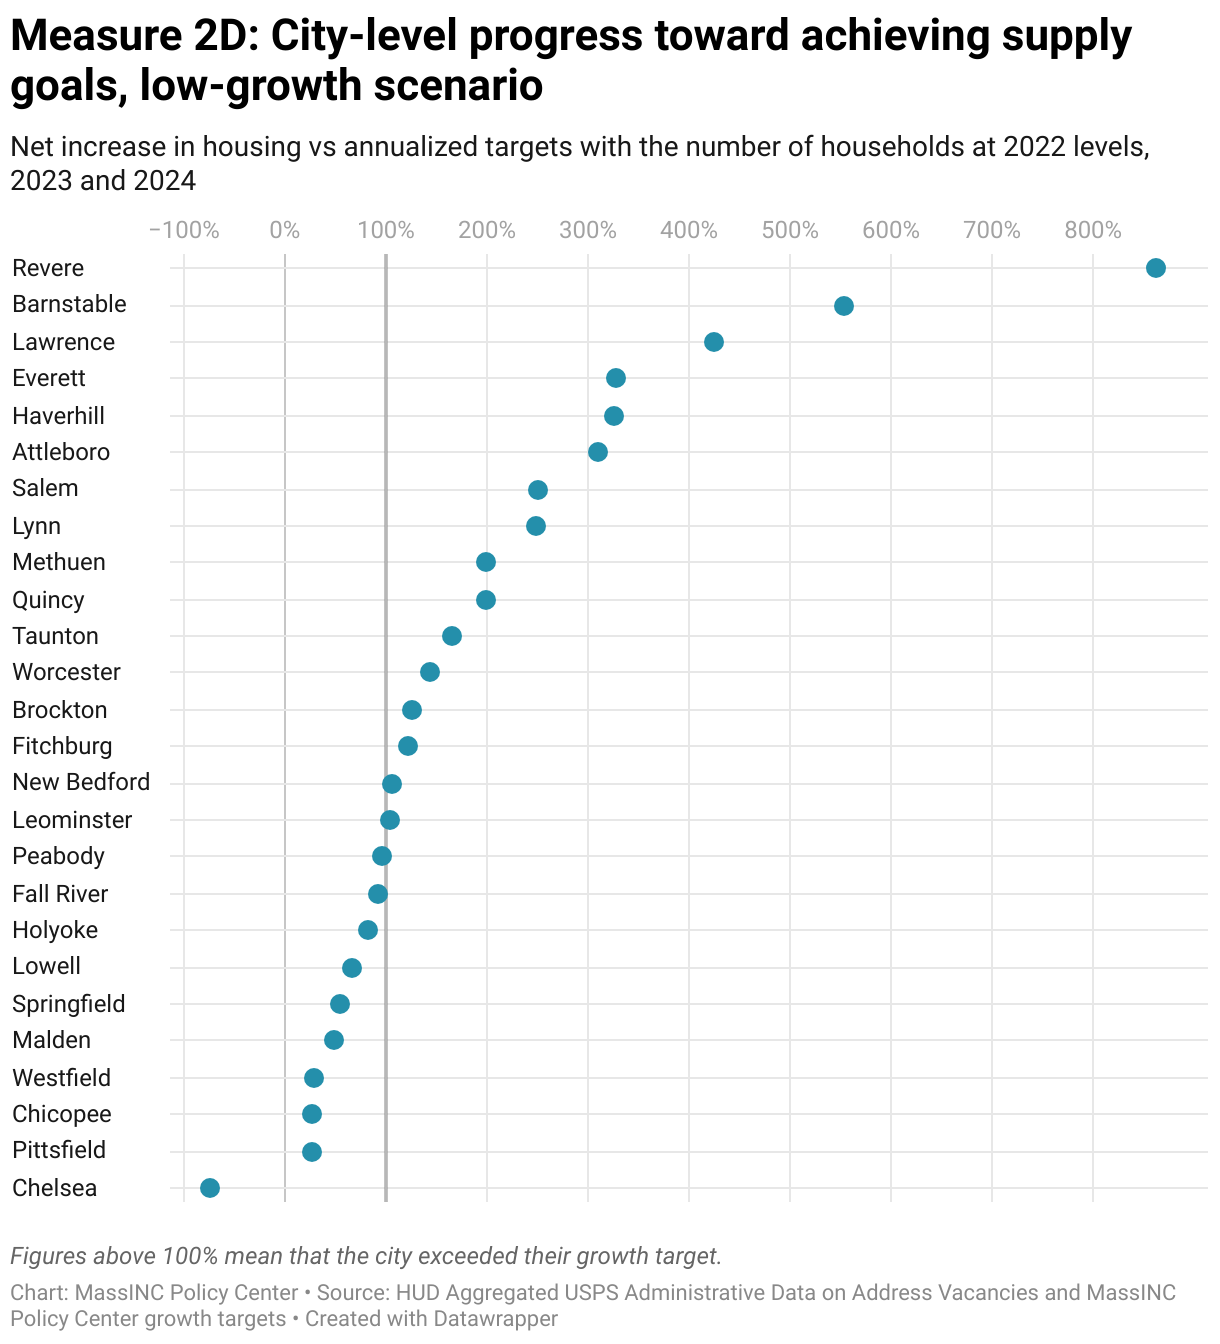
Measure 2A shows the cumulative progress that Gateway Cities have made toward the full 83,000-unit target since 2022. To gauge progress if household growth stalls due to more restrictive immigration policies and/or a slowing economy, Measure 2B presents a no growth scenario, which shows the unmet housing needs if existing population levels (as of 2022) continue unchanged.
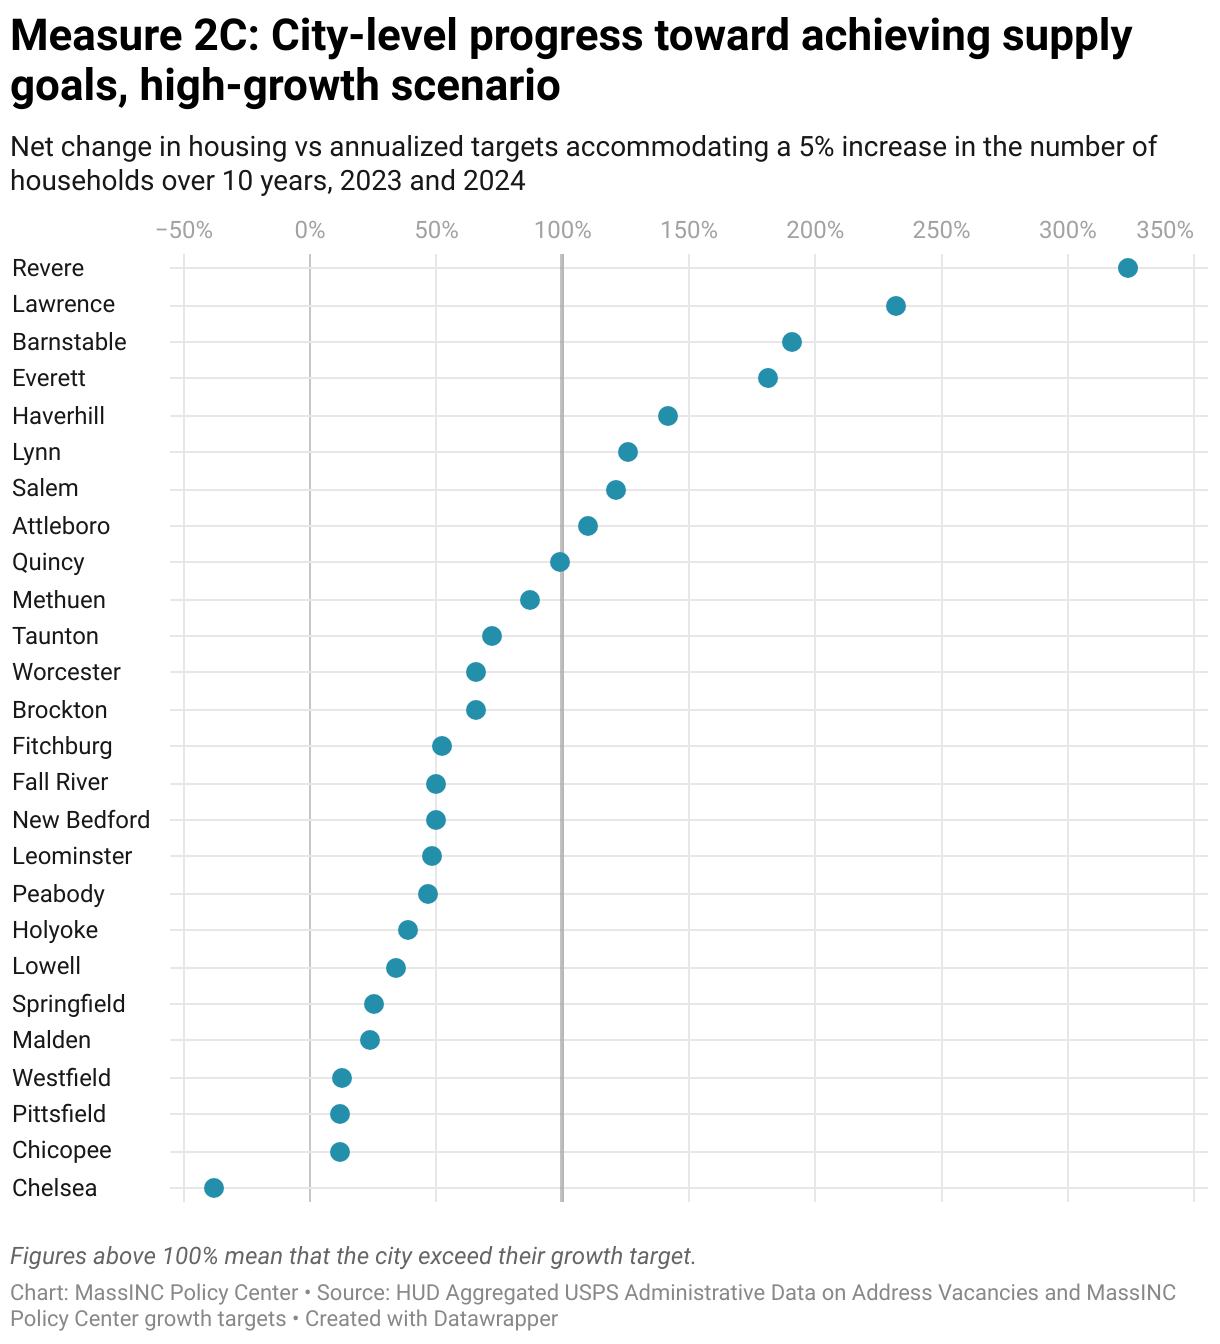
Measures 2B and 2C follow progress at the city level. The 100-percent threshold indicates being on pace to reach the 2032 target. The dots show where each city stands relative to its target as of 2024.
Why is this important?
Tracking housing production against clear targets makes it possible to hold ourselves accountable for keeping pace with demand. When supply falls short of demand, rents and home prices rise, families face greater housing instability, and Gateway Cities risk losing momentum in revitalizing their downtowns and neighborhoods. Regular measurement provides an early warning system, showing whether we are on pace or if greater effort is needed to keep housing affordable and communities thriving.
Notes about the data
Of the 83,000 housing units Gateway Cities need to add over ten years to catch up to housing demand, about 8,000 units are needed to replace housing that is inevitably lost over time, whether due to fire, demolition, or other causes. Therefore, on net, the overall Gateway City housing supply needs to increase by about 75,000 units. Without population growth, this drops to just 36,000 units. Averaged out over time, this equates to 7,500 new homes per year on the high end or about 3,600 units per year on the low end. More information about how targets were calculated can be found in the 2024 Gateway Cities Housing Monitor.
How are Gateway Cities doing?
In 2023 and 2024, Gateway Cities added 12,000 residential addresses. While the growth from 2022 to 2023 fell short of the target (7,500) by just 155 units, by 2024 the cumulative distance from the target had grown to nearly 3,000 units. This means that two years in, Gateway Cities are behind by 20 percent. However, dramatic changes to immigration policy at the federal level means that fewer units may be needed to accommodate population growth, especially since international migration is the main driver of population growth in Gateway Cities.
If we exclude population growth and look just at the level of production required to reduce vacancy rates to healthy levels at 2022 population counts, Gateway Cities exceed the target growth by 4,800 units. This does not suggest that supply is catching up to demand in the near-term, as Gateway Cities grew faster than predicted in 2023 and likely grew at a fast pace in 2024 as well. However, federal immigration enforcement action and the weakening economy could significantly reduce household growth in Gateway Cities in the coming years.
On a city-by-city basis, the results are mixed. With population growth included, 9 out of 26 Gateway Cities met or exceeded their production targets. Without population growth, nearly twice as many (17) are on track to stabilize prices. All of the Gateway Cities west of Worcester experienced the slowest housing growth, and none of them met their growth targets either with or without population growth included.
3. New Housing Types
What does this measure?
Drawing from assessors’ records, these data show the size of new residential buildings and whether they were built from the ground up or by converting former mills, schools, churches, office buildings and other older structures. Together, these metrics reveal not just the scale of housing growth, but the physical forms and development strategies communities are relying on to expand their housing stock.
Why is this important?
The composition of new housing shapes the long-term trajectory of neighborhoods. Large-scale multifamily developments play a vital role by adding significant numbers of units, especially in locations that can support higher density. At the same time, “missing middle” structures with four to eight units provide a human-scaled transition between high-density centers and single-family areas, support walkable infill, and have historically offered a pathway to wealth-building for middle-income households. The balance between adaptive reuse and new construction is important to keep track of. Reuse projects can address blight, preserve historic character, and sometimes deliver housing more cost-effectively than new construction, but they face unique design and financing hurdles. As the most feasible reuse opportunities are absorbed, reliance on ground-up construction is likely to grow, raising new financial and regulatory challenges.
Notes about the data
These estimates were generated from municipal assessors data compiled by MassGIS. Annual reporting is encouraged but not consistent for all cities from year to year. Categories for building types are determined by available land use codes. Communities vary in how they apply land use codes, and many do not report unit counts. When unit counts are missing, they are estimated by dividing the square footage of the new building by the average residential square footage per unit of the existing housing stock. For FY23 to FY25, data were available for all Gateway Cities except Everett, New Bedford, and Revere. These gaps and inconsistencies mean that results are best interpreted as broad patterns in building and construction type rather than precise counts.
How are Gateway Cities doing?
Between 2022 and 2024, single-family homes, condominiums, and townhouses made up 25 percent of new housing. At the other end of the spectrum, buildings with eight or more units accounted for an estimated 43 percent of new housing. The middle of the spectrum—the so-called “missing middle”—is truly missing, with just 5 percent of production coming from buildings with between two and eight units. This imbalance suggests that current incentives and regulations may not support the small-scale, in-fill development that enables gentle density and incremental growth.
We estimate that from 2022 to 2024, 16 percent of new housing production came from adaptive reuse of commercial, civic, and industrial buildings, while the remaining 84 percent came from ground-up new construction. This is down from 43 percent adaptive reuse and 57 percent new construction over the previous 10 years. This trend may cause one to wonder whether the stock of low-hanging fruit, such as vacant mills that are in decent shape for redevelopment, is beginning to diminish. As the low-hanging fruit is absorbed and what remains are the more difficult properties and ground-up construction, this may contribute to a widening financial gap for new development.
4. Transit-Oriented Development
What does this measure?
This measure uses assessors’ records to identify the share of new housing located within half a mile of Amtrak and Massachusetts Bay Transportation Authority (MBTA) Commuter Rail stations. It focuses specifically on regional rail, which—unlike subway service in Boston—represents the primary rail service available to most Gateway Cities.
Why is this important?
This level of detail provides a smart-growth lens on Gateway City housing production, showing whether growth is occurring in places where residents can best take advantage of transit and existing public infrastructure. Transit and housing thrive when they grow together. Concentrating new homes near rail stations builds walkable neighborhoods, expands access to jobs, and strengthens ridership. In turn, higher ridership justifies greater service, which further increases the value of living near transit. Tracking this measure shows whether new housing production is leveraging these intercity transit investments and helping to set off the mutually reinforcing cycle of stronger service and stronger housing demand.
Notes about the data
These estimates draw from municipal assessors’ data compiled by MassGIS. Annual reporting is encouraged but not consistent for all cities from year to year. For FY23 to FY25, data were available for all Gateway Cities except Everett, New Bedford, and Revere. These gaps and inconsistencies mean that results are best interpreted as broad patterns in building and construction type rather than precise counts.
How are Gateway Cities doing?
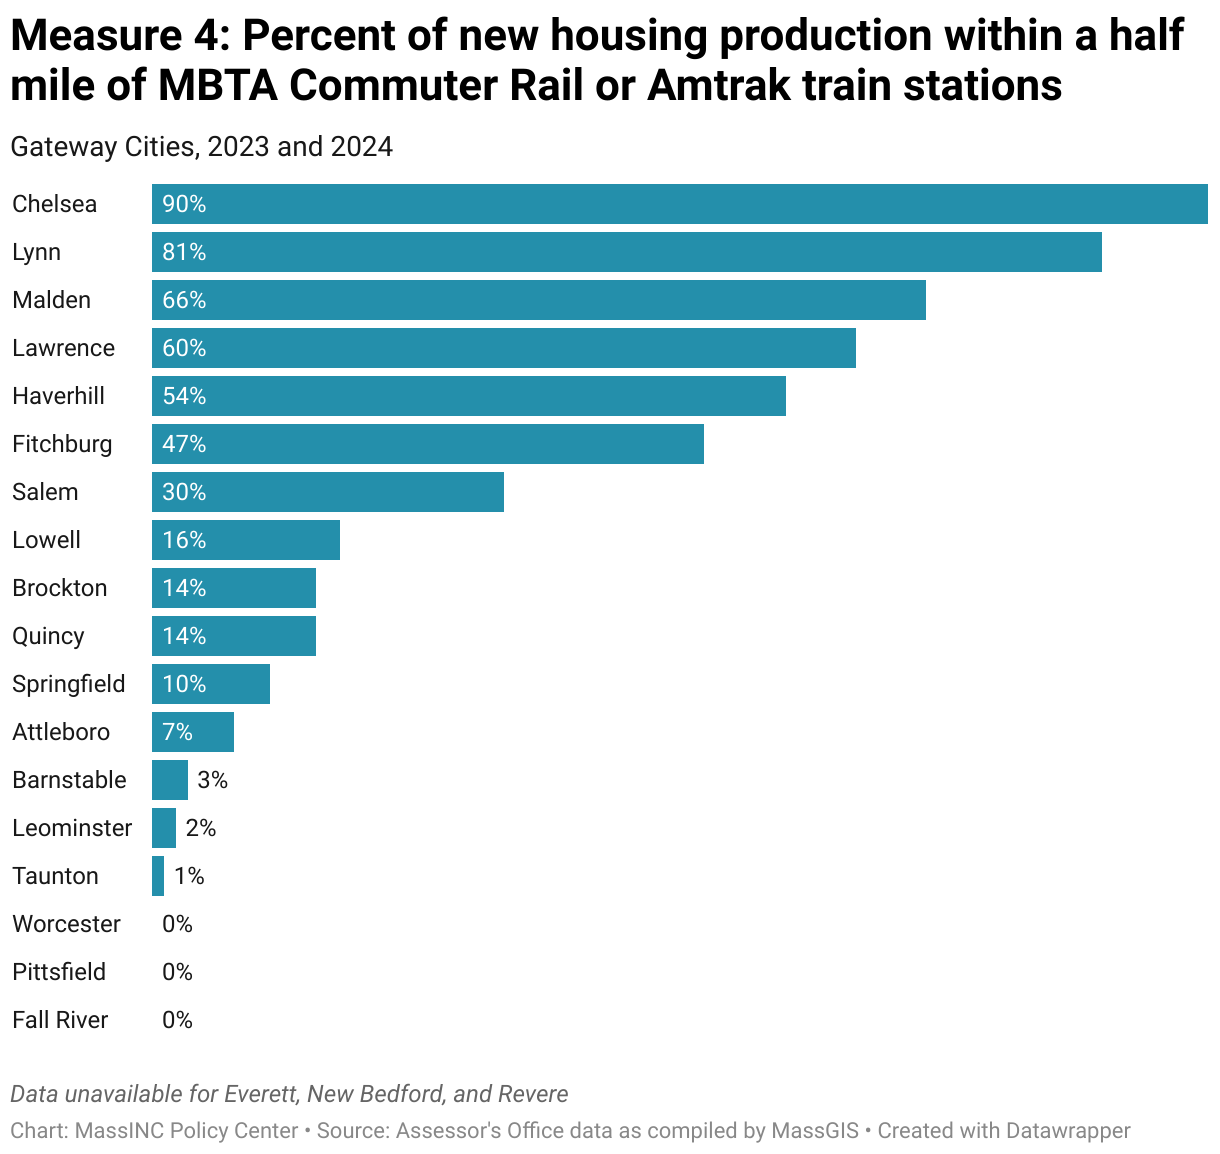
On average, 30 percent of the new housing in Gateway Cities was built within half a mile of a rail station in communities with train service. This is exactly on pace with the share of housing built within walking distance of train stations during the previous 10 years. Because several cities are in the process of creating new zoning districts for compliance with the MBTA Communities Act, we expect this number to increase in future years. Compact Chelsea leads the pack with 90 percent of new housing created within walking distance of their train station. However, Haverhill, Lawrence, Lynn, and Malden all saw more than half of their new housing located near transit.
5. Residential Building Permits
What does this measure?
Permitting data show the number of new residential buildings authorized each year, distinguishing between smaller one- and two-family homes and larger three-or-more-unit buildings. Unlike address data, permits do not track net changes in housing units, since permitted projects are not always constructed and permit figures do not account for demolitions or the total number of units inside each building. Instead, they highlight patterns in the type and scale of new construction moving through the pipeline.
Why is this important?
While address data show how the housing stock has already changed, permitting data provide a forward-looking view. Because homes must be permitted before they can be built, permits serve as a leading indicator of both the overall volume of construction on the horizon and of the types of housing proposed—from smaller one- and two-family homes to larger multifamily developments. These trends reflect not only broader market conditions but also municipal choices about whether to allow more multifamily growth or rely primarily on single-family homes.
Notes about the data
The permitting figures reported here come from the US Census Bureau’s Building Permits Survey, which relies on municipalities to voluntarily report the number of permits they issue. Participation is inconsistent, with some cities providing complete data and others not. To fill these gaps, the Census Bureau imputes missing values using statistical methods. In 2024, data were imputed for 8 of the 26 Gateway Cities. While this means city-level figures may not always be precise, the approach is applied consistently enough over time that the trends remain meaningful.
Units were estimated based on average per-building unit counts for cities reporting both the number of permits and the total number of units by building type.
How are Gateway Cities doing?
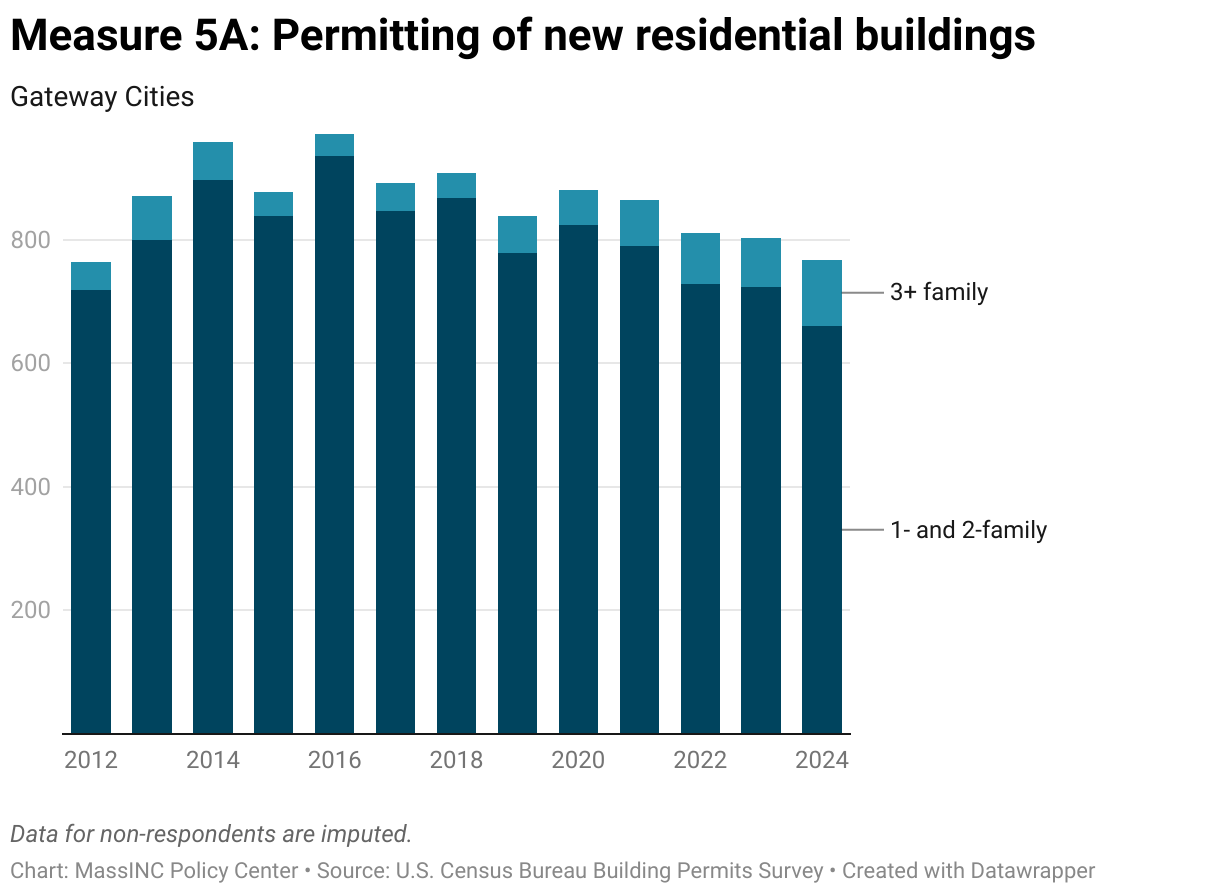
Permitting patterns in Gateway Cities looked very different before and after 2018. For much of the 2010s, one- and two-family homes dominated, with relatively few multifamily buildings coming through the pipeline. Beginning in 2018, however, the trend line shifted: multifamily permitting increased while one- and two-family activity declined.
The shift is especially clear in the most recent years. In 2024 alone, Gateway Cities permitted 106 multifamily buildings—the highest figure in over a decade and more than double the 2012–2017 average. From 2022 to 2024, permits for multifamily buildings rose 30 percent, while one- and two-family permits fell by about 9 percent.
In unit terms, the estimated number of multifamily homes nearly doubled, reaching 2,791 in 2024, which accounts for about 80 percent of all new units permitted. This suggests a growing reliance on multifamily construction to expand supply, reinforced by both one-time and ongoing funding streams, such as federal American Rescue Plan Act (ARPA) grants, the expanded state Housing Development Incentive Program (HDIP), and increased state bond funds and tax incentives for affordable housing development. The key question is whether these recent highs mark a lasting structural change in Gateway City housing production, or merely a temporary spike tied to one-time resources.
6. Vacancy Rates
What does this measure?
Drawing on several data sources, this indicator provides vacancy rates in both the rental and for-sale market, as well as in the aggregate across both types of housing. The United States Postal Service (USPS) collects quarterly information on whether an address is vacant based on reports from postal carriers. These USPS data provide near real-time monitoring of supply constraints, but they treat units as simply occupied or vacant. This means the data cannot distinguish between homes that are available for purchase and those that are available to rent.
To capture these submarkets, we use the American Community Survey (ACS). While ACS estimates are less timely, they separate for-rent and for-sale vacancies. They also enable researchers to focus only on on-market housing, excluding units that are not occupied for other reasons (e.g., due to blight or because they are held for seasonal use). This makes the ACS a more precise measure of the vacancies that directly affect housing supply and price pressures.
Why is this important?
The natural vacancy rate is the share of housing units that must remain empty at any given time for the market to function smoothly, without persistent upward or downward pressure on prices. Some level of vacancy is necessary—households need time to move, landlords need time to prepare units, and buyers often sell one home before purchasing another. When rates fall below the natural vacancy rate, the competition for available units intensifies, and prices tend to rise.
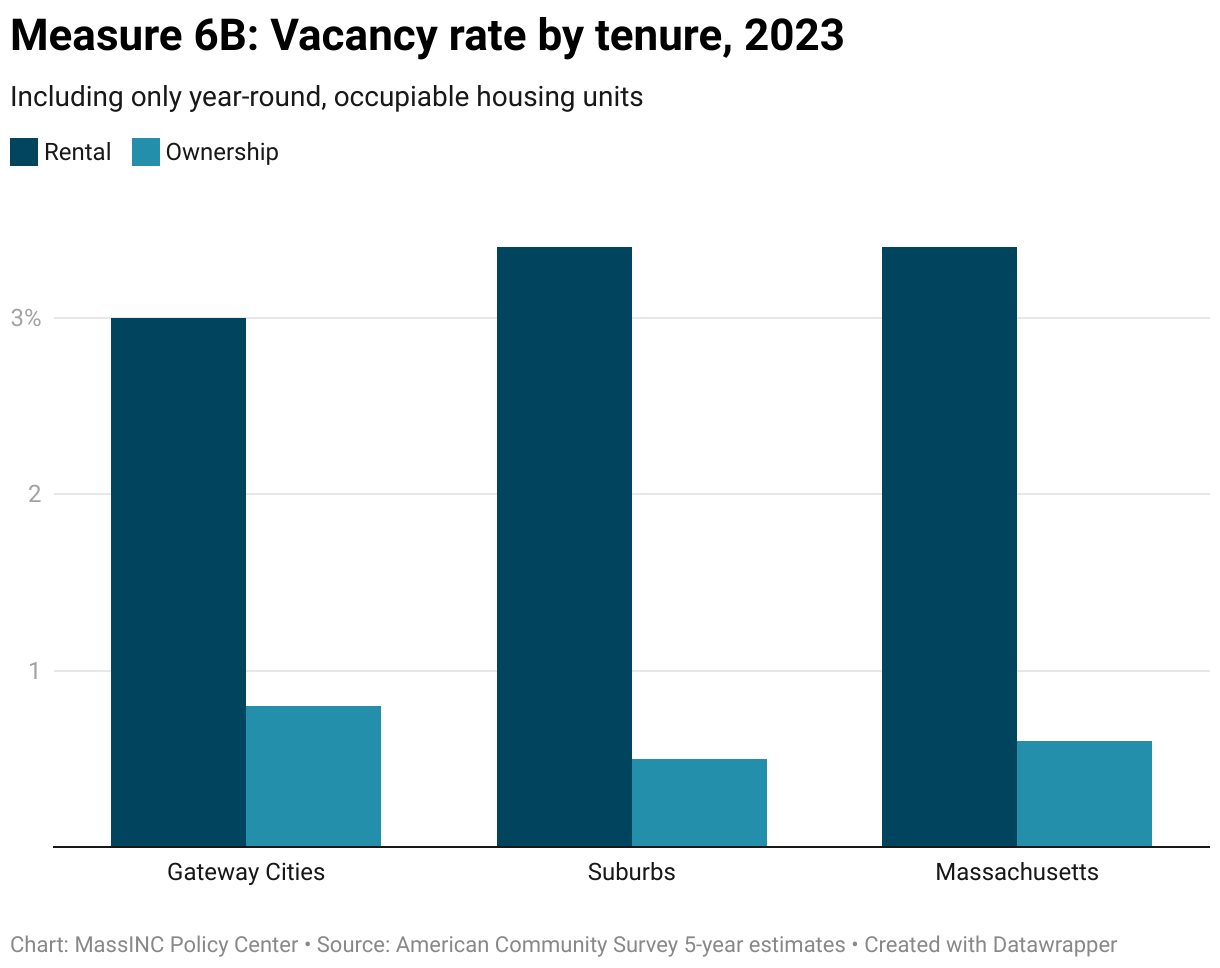
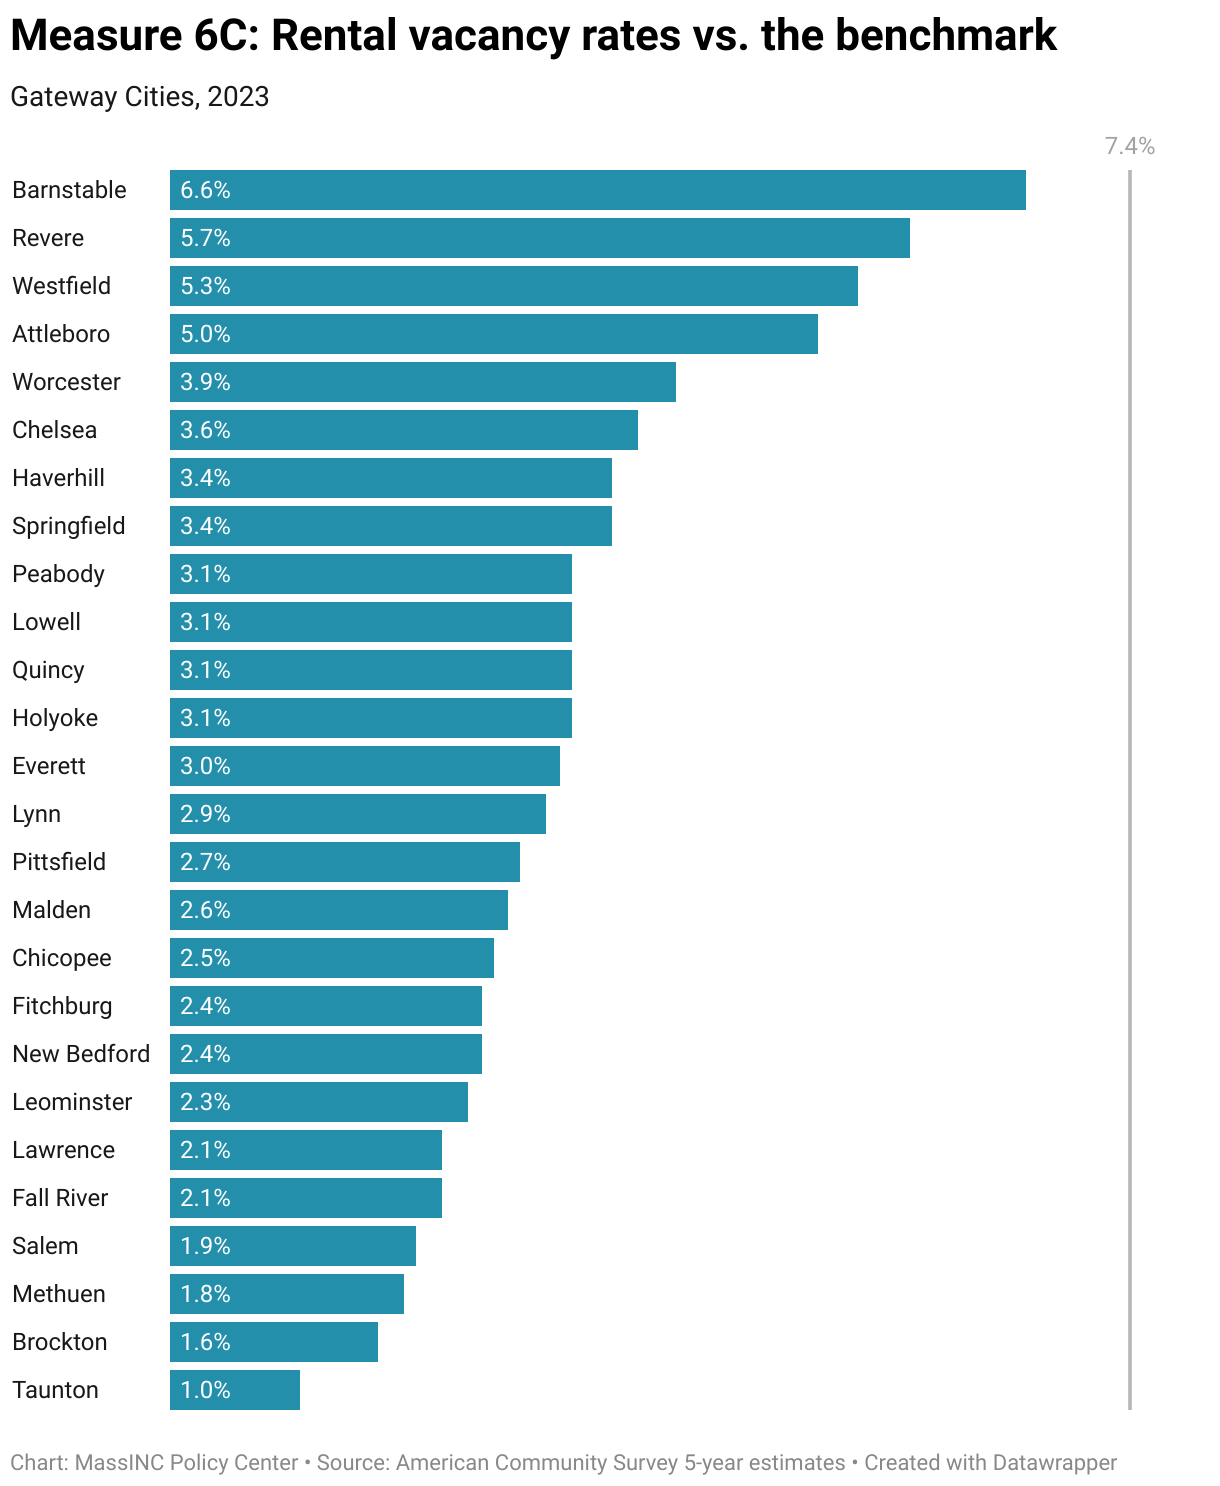
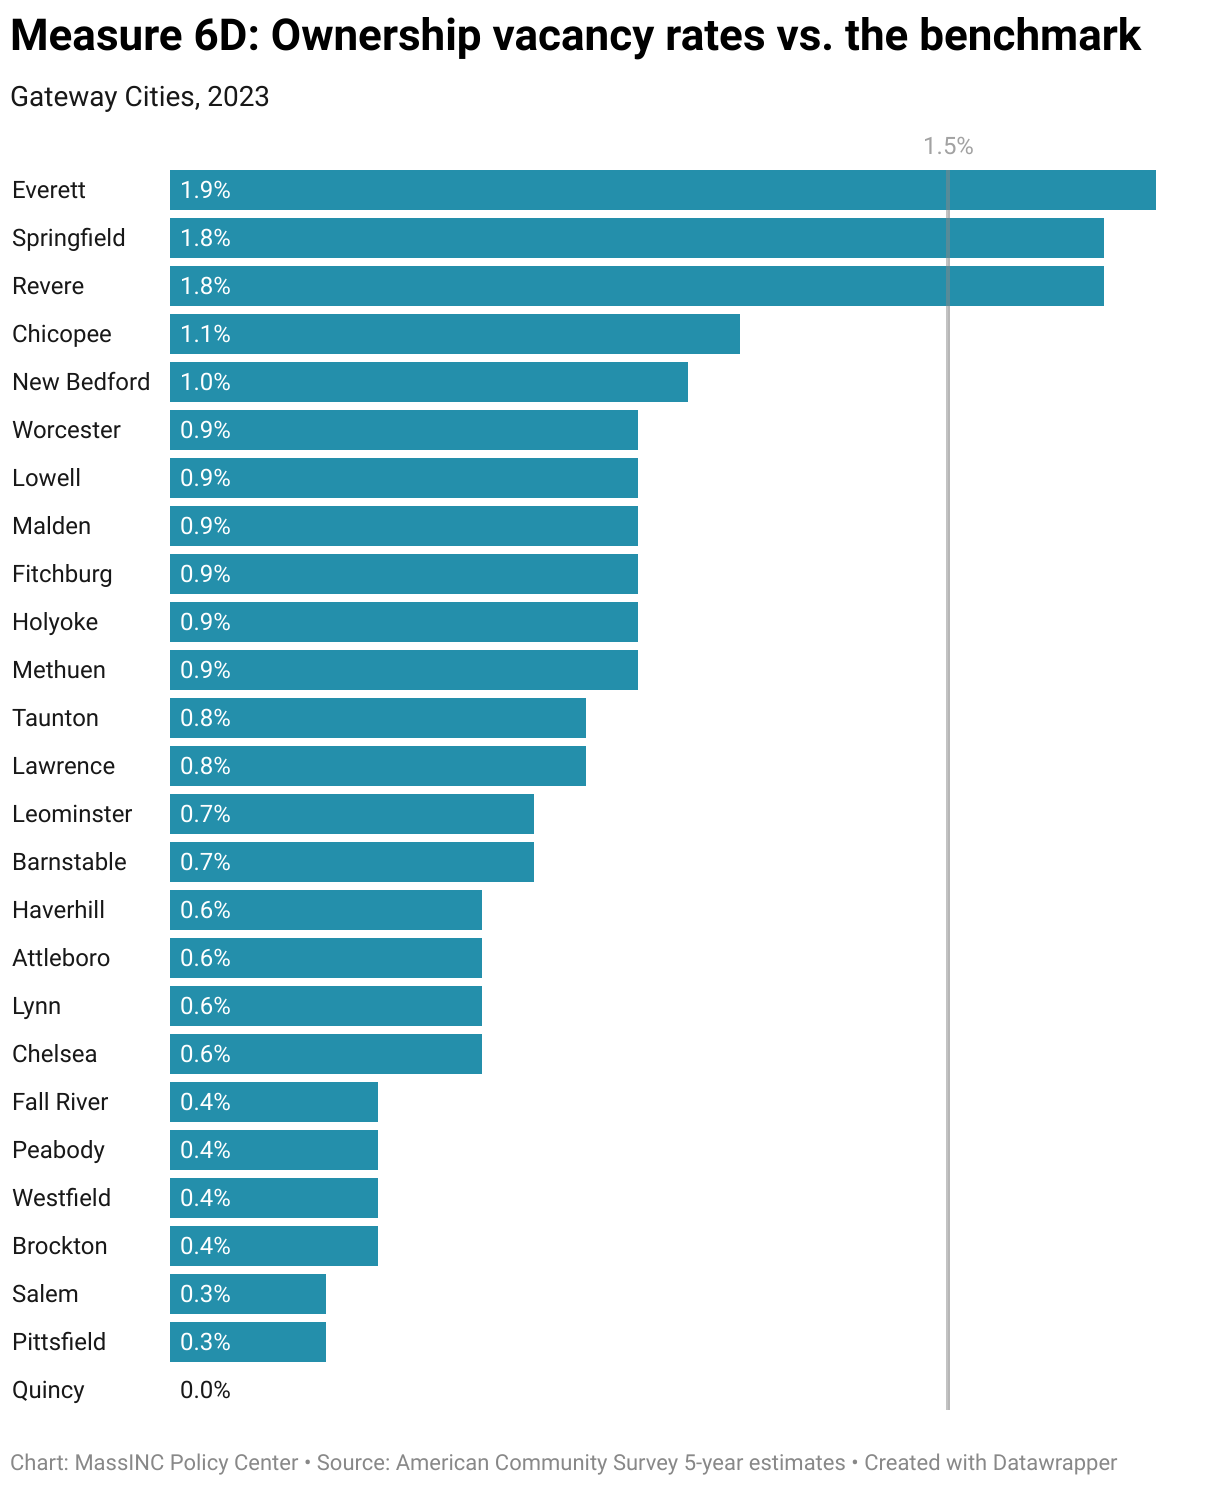
Economists generally use a benchmark of 5 percent for blended vacancy rates, which combine both rental and ownership units as in the USPS data. More detailed research by Harvard’s Joint Center for Housing Studies finds that the equilibrium differs by tenure; it is about 7.4 percent for rental housing, where turnover is high, and just 1.5 percent for ownership housing, where households typically stay put for longer periods. Taken together, these thresholds provide the benchmarks we use to evaluate vacancy trends in Gateway Cities.
Notes about the data
HUD Aggregated USPS Administrative Data: The vacancy counts reflect postal operations, not housing market activity. As USPS describes it, an address is either occupied and requires mail service or vacant and does not. This makes the measure timely but imperfect for capturing whether homes are actually available for occupancy.
No-Stat addresses: The USPS also tracks “No-Stat” addresses, which include units under construction, demolished or condemned properties, and certain rural delivery points. These are excluded from the vacancy counts used here.
ACS estimates: The American Community Survey (ACS) produces both 1-year and 5-year estimates, but 1-year results are limited to geographies with populations above 65,000. Because most Gateway Cities and all sub-city geographies fall below this threshold, we rely on 5-year estimates. As a result, the data smooth over short-term fluctuations, and small changes between periods may not be statistically meaningful.
How are Gateway Cities doing?
In the aggregate, residential vacancy rates for both Gateway Cities and their suburbs are well below the 5 percent threshold. However, there has been a slight improvement, with vacancies increasing from the first quarter of 2023 to the first quarter of 2025 by a tenth of a percentage point in Gateway Cities and three tenths of a percentage point in their suburbs.
While the vacancy rate is slightly higher in Gateway Cities—2.6 percent compared to 1.5 percent in the suburbs—this is to be expected because rental markets require a significantly higher vacancy rate to accommodate the high degree of churn in the rental market. The most recent ACS figures show that the aggregate rental and homeownership vacancy rates for Gateway Cities and their suburbs are similar. While the rates vary by city, almost every community falls well below the natural vacancy rate for both rental and for-sale housing. The only cases of exceeding the minimum vacancy rate are for ownership properties in Everett, Springfield, and Revere.
2025 Gateway Cities Housing Monitor
Chapters
Chapter 1: Housing Production and Supply
Chapter 2: Housing Affordability
Chapter 3: Conditions for Growth
Chapter 4: Neighborhood Revitalization

2025 Gateway Cities Housing Monitor
September 17, 2025