
Cities are doing more to unlock housing, but large financial gaps remain a major barrier.
Gateway Cities are increasingly working to lower the financial, regulatory, and infrastructure-related barriers to new housing development. But the high cost of construction makes it economically challenging to produce new housing, especially in communities with lower home values. Many still have additional policy levers that they can pull to lower the barriers. This chapter quantifies the financial gap for each community and the policies they have in place to help developers close it. Extending analysis presented in the 2024 Housing Monitor, this chapter also looks at the interplay between transportation infrastructure and housing development in Gateway Cities with rail service.
Key Findings
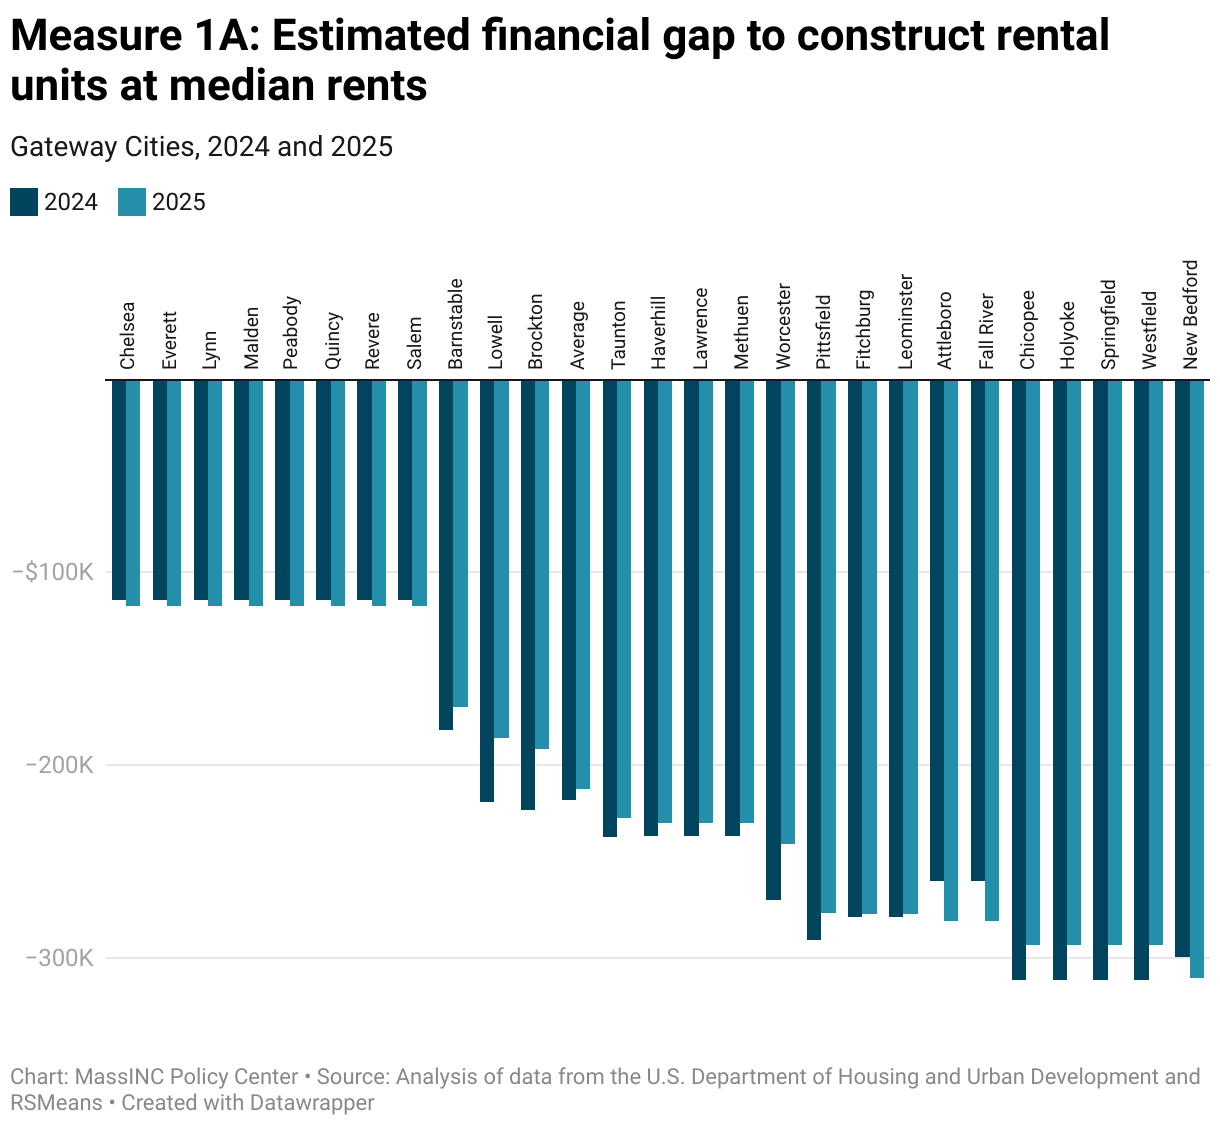
- The financial gap for the construction of new rental housing held steady from 2024 to 2025 at about $212,000 per unit, on average, across Gateway Cities.
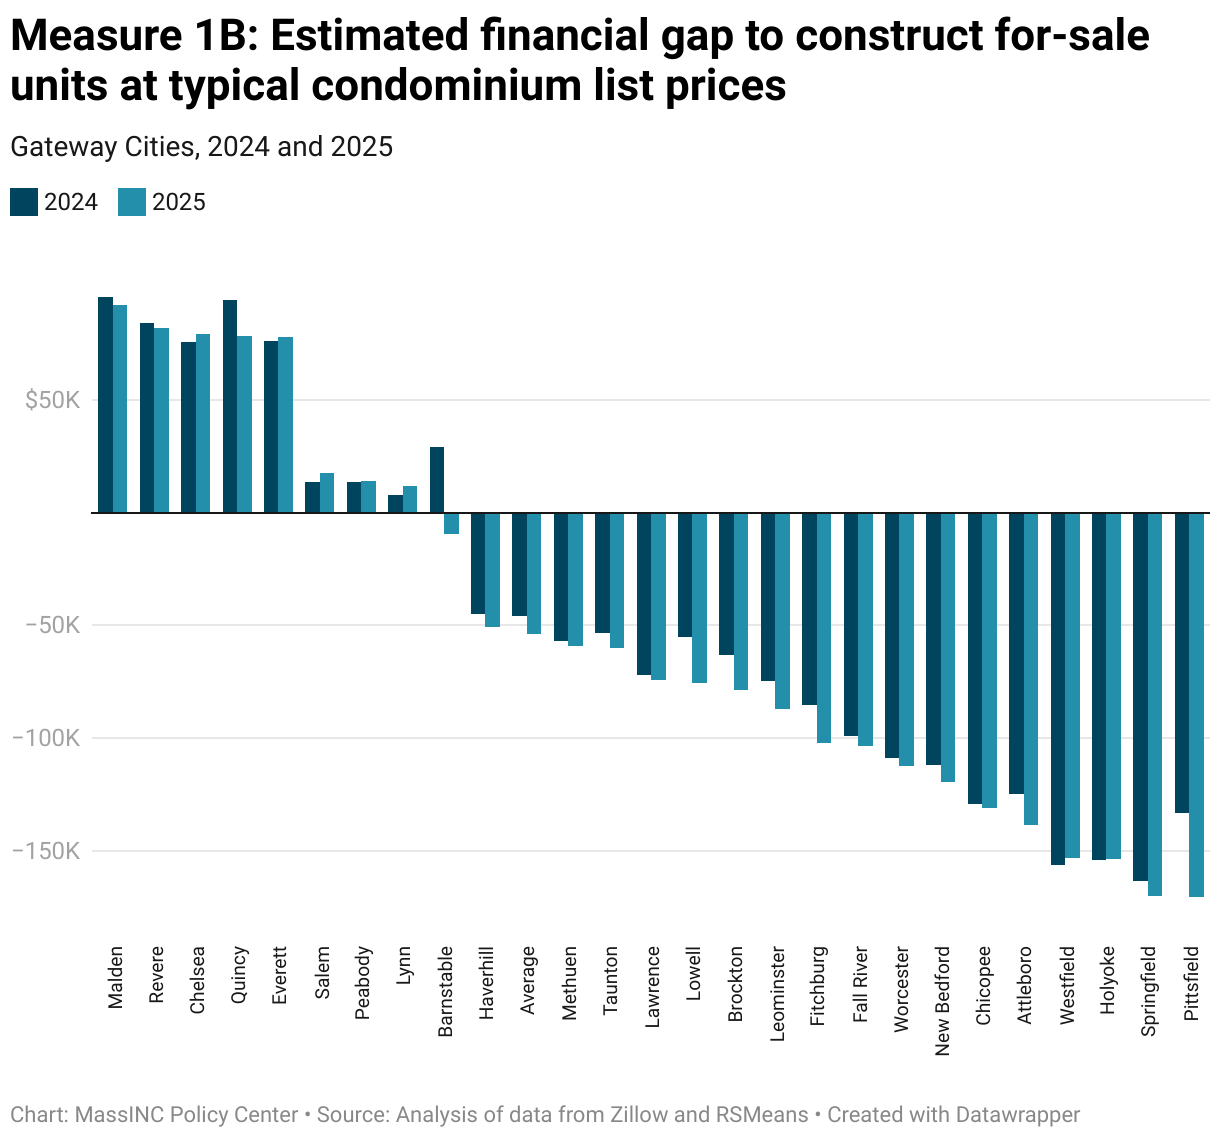
- The financial gap for the construction of new for-sale homes is much lower at just $64,000, on average, across Gateway Cities. However, the for-sale financial gap widened slightly (+14 percent) in inflation-adjusted terms because unlike rents, home values did not increase as much as construction costs over the past year.
- Gateway Cities have stepped up efforts to close the financial gap over the past year: Five reduced parking requirements, four created new zoning districts for multifamily housing, and three began offering tax abatements and other financial incentives to make residential development more economically feasible.
- Transit improvements will increase land values and make residential development more feasible, but Gateway Cities’ station areas do not currently have enough residents and jobs to support high-frequency transit. They are gaining residents in their station areas through infill development, but most have lost significant downtown employment since the pandemic. Increasing density to support more frequent transit service will require additional residential development and new strategies to bring people back to the office and rebuild the downtown commercial base.
The sections that follow unpack this chapter’s key findings with greater detail on what each measure captures, why it matters, and how Gateway Cities and their suburbs are performing. Each topic can be expanded by clicking on the dropdowns, where you’ll also find notes about the data sources and methods used. Interactive charts allow you to hover over points for additional detail and share snapshots directly to social media. For those who want to dig deeper, the underlying datasets are available to download and explore. Together, these tools provide both a quick overview and a deeper dive into housing affordability in Gateway Cities.
1. Financial Gaps
What does this measure?
This analysis measures whether rental income and sale prices in each Gateway City are sufficient to cover the full costs of acquiring land and constructing new housing. Comparing development costs to market values exposes the “capital gap” and provides an indication of how much subsidy will be required to make projects financially feasible.
Why is this important?
Tracking the capital gap shows whether the private market can feasibly build the housing that Gateway Cities need to stabilize prices.
Notes about the data
Land acquisition was assumed to represent 20 percent of total costs, while construction costs were derived from RS Means estimates for a six-story multifamily building, adjusted with local price factors. The model pro forma assumes annual operating expenses of $10,000 per unit per year. Net operating income was estimated by subtracting standard operating costs from annual rent (HUD 50th percentile fair market rents for a two-bedroom apartment). This figure was then capitalized using an 8 percent rate, which represents the return investors typically expect for properties in comparable markets. Dividing income by this rate yields an income-based valuation of the unit. Comparing this valuation to development costs revealed the capital gap for rental projects.
For the ownership scenario, market values were estimated using the Zillow Home Value Index per square foot for condominiums, normalized by average unit size in each city. The for-sale capital gap was then calculated as the difference between market price and development cost, scaled to a typical 1,200 square foot condominium unit. To improve the comparison between rental and for-sale properties, this year’s analysis also includes a $10,000 per unit contribution to reserves (all comparisons to last year’s estimates also include this additional expense).
How are Gateway Cities doing?
In 2025, the average financial gap for new apartments across Gateway Cities was $212,000 per unit at median rent levels. This was just a slight increase from the 2024 estimate in nominal terms. However, because rents increased at roughly the same price as development costs, the 2025 gap is essentially the same after adjusting for inflation.
The financial gap to construct mid-tier apartments is lowest in the Gateway Cities closest to Boston, where rents are the highest. The financial gap is much wider in New Bedford ($311,000) and Springfield ($294,000). In Brockton, Lowell, and Worcester, rent increases outpaced the increase in development costs. This narrowed the financial gaps significantly. However, projects with median rents in these cities still face a large delta.
The for-sale homes financial gap at the average home value is just $64,000, on average, across Gateway Cities—much lower than the gap for rentals. However, the for-sale financial gap widened slightly (+14 percent) in inflation-adjusted terms because unlike rents, home values did not increase as much as construction costs over the past year.
The for-sale gap is largest in Western Massachusetts cities like Holyoke ($153,000), Springfield ($170,00), and Pittsfield ($171,000). In eight Gateway Cities closest to Boston, there is no financial gap to construct mid-tier condominiums.
2. Housing Subsidies
What does this measure?
This data tracks the financial tools Gateway Cities can use to reduce the cost of housing production and make projects viable. Each measure reflects a different funding source or local option:
- Housing Development Incentive Program (HDIP): A state program that provides tax incentives to developers of market-rate housing in Gateway Cities; municipalities must opt in by creating an HDIP district, which can cover part or all of the city.
- Community Preservation Act (CPA): A local property tax surcharge that raises funds for historic preservation, open space, and housing. Cities adopting the CPA can choose how to allocate funds, but at least 10 percent must go to housing.
- Community Development Block Grants (CDBG): Federal funds that cities can award to local Community-Based Development Organizations (CBDOs) to support housing construction and neighborhood revitalization.
- HUD HOME Investment Partnerships Program (HOME): The largest federal block grant for affordable housing, administered by cities or regional consortia, and used for new housing development as well as rehabilitation.
- Municipal Affordable Housing Trust Fund: A local fund that cities can establish to collect and deploy revenue specifically for affordable housing development.
- Urban Center Housing Tax Increment Financing (UCH-TIF): A state program allowing cities to offer property tax exemptions to encourage private investment in mixed-use and residential projects in urban centers.
Together, these measures show which state, federal, and local resources cities are using—or not using—to offset development costs and attract new housing investment.
Why is this important?
Public incentives play an important role closing financial gaps. Making this information visible helps developers better navigate the complex funding landscape, while encouraging learning and even a bit of healthy competition among Gateway Cities striving to draw private investment to residential development.
Notes about the data
The MassINC Policy Center collected these data through an annual housing survey and consultation with state agencies. Attleboro and Fall River did not respond to the 2025 survey; as a result, this analysis relies on their 2024 responses.
How are Gateway Cities doing?
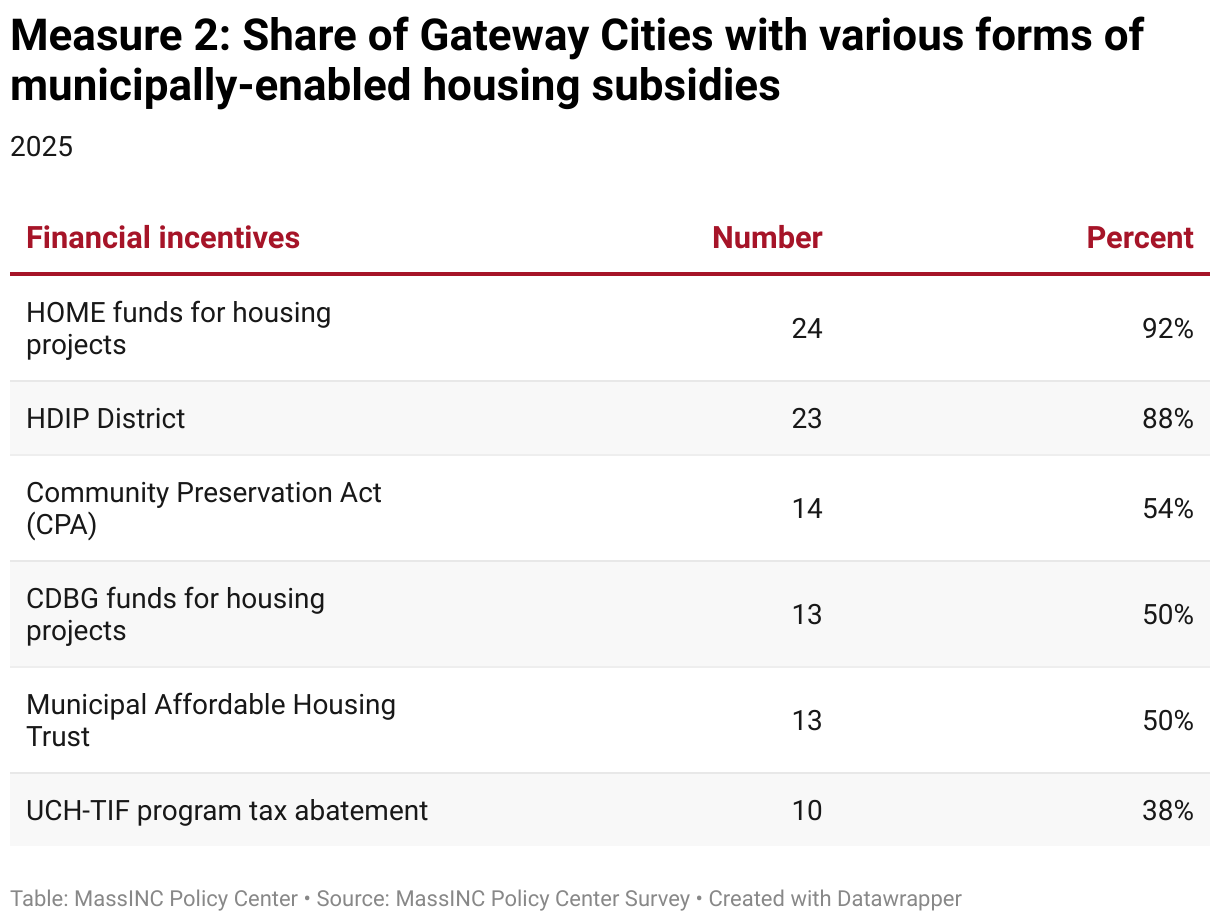
In 2025, the most widely used tools among Gateway Cities are the federal HOME Partnership Program (HOME) and the state Housing Development Incentive Program (HDIP). Nearly every city reports drawing on HUD HOME Partnership Program funds, and all but three have adopted HDIP districts. By contrast, programs like the Community Preservation Act (CPA), municipal affordable housing trusts, and Community Development Block Grants (CDBG) fall into a middle tier of adoption—used by about half of cities to spur residential development. The Urban Center Housing Tax Increment Financing (UCH-TIF) remains relatively rare, though it gained some traction, with two cities offering UCH-TIF for the first time between 2024 and 2025.
Top performers in 2025 (most positive responses):
- Salem (8/8)
- Worcester (7/8)
- Quincy (7/8)
Major changes from 2024 to 2025:
- Chelsea and Everett started using UCH-TIF
- Revere created an HDIP zone
3. Regulatory Conditions
What does this measure?
These data track the zoning and permitting reforms that Gateway Cities have adopted to make it easier and more predictable to build housing. Each measure removes a different barrier or creates a new pathway for development. By increasing predictability and reducing delays, these reforms can lower the cost of capital as well as carrying costs:
- Reduced parking minimums: Lower the cost of new construction by requiring fewer parking spaces per unit. They also free up land and resources for housing. In some cases, high parking requirements can make the residential or mixed-use redevelopment of existing commercial buildings impossible on the existing footprint.
- By-right multifamily zoning: Allows larger projects to proceed without a special permit or discretionary review.
- Expedited permitting: Shortens approval timelines for multifamily housing.
- Master planning or pre-permitting: Designates areas where multifamily housing is already cleared through local planning, creating “shovel-ready” sites.
- Duplexes allowed by-right: Makes it easier to build two-family homes on most residential parcels, a traditional form of housing in Gateway Cities.
- Three-family buildings allowed by-right: Extends this flexibility to triple-deckers, another iconic and efficient New England housing type.
- Density bonuses and regulatory relief: Give developers incentives to include affordable units by allowing them to build more housing than zoning would normally permit.
Together, these measures capture the extent to which local zoning rules either enable or restrict different kinds of housing production, from large-scale multifamily development to incremental neighborhood growth.
Why is this important?
Financing tools can help close gaps, but no amount of subsidy can overcome local rules that make housing illegal or impractical to build. Zoning and permitting reforms are therefore foundational: they establish whether new housing is even possible, and at what scale. By comparing Gateway Cities, this data makes visible where local governments are lowering barriers and where restrictive land use regulation holds back growth. Sharing this information not only equips policymakers and developers to identify opportunities; it also facilitates peer learning and encourages a measure of competition among cities working to attract new residents, investment, and housing production.
Notes about the data
Attleboro and Fall River did not respond to the 2025 survey; as a result, this analysis relies mostly on their 2024 responses (publicly available data on MBTA compliance and the creation of transit-oriented development (TOD) zones was used to gather 2025 data for Attleboro on multifamily zoning and parking requirements).
How are Gateway Cities doing?
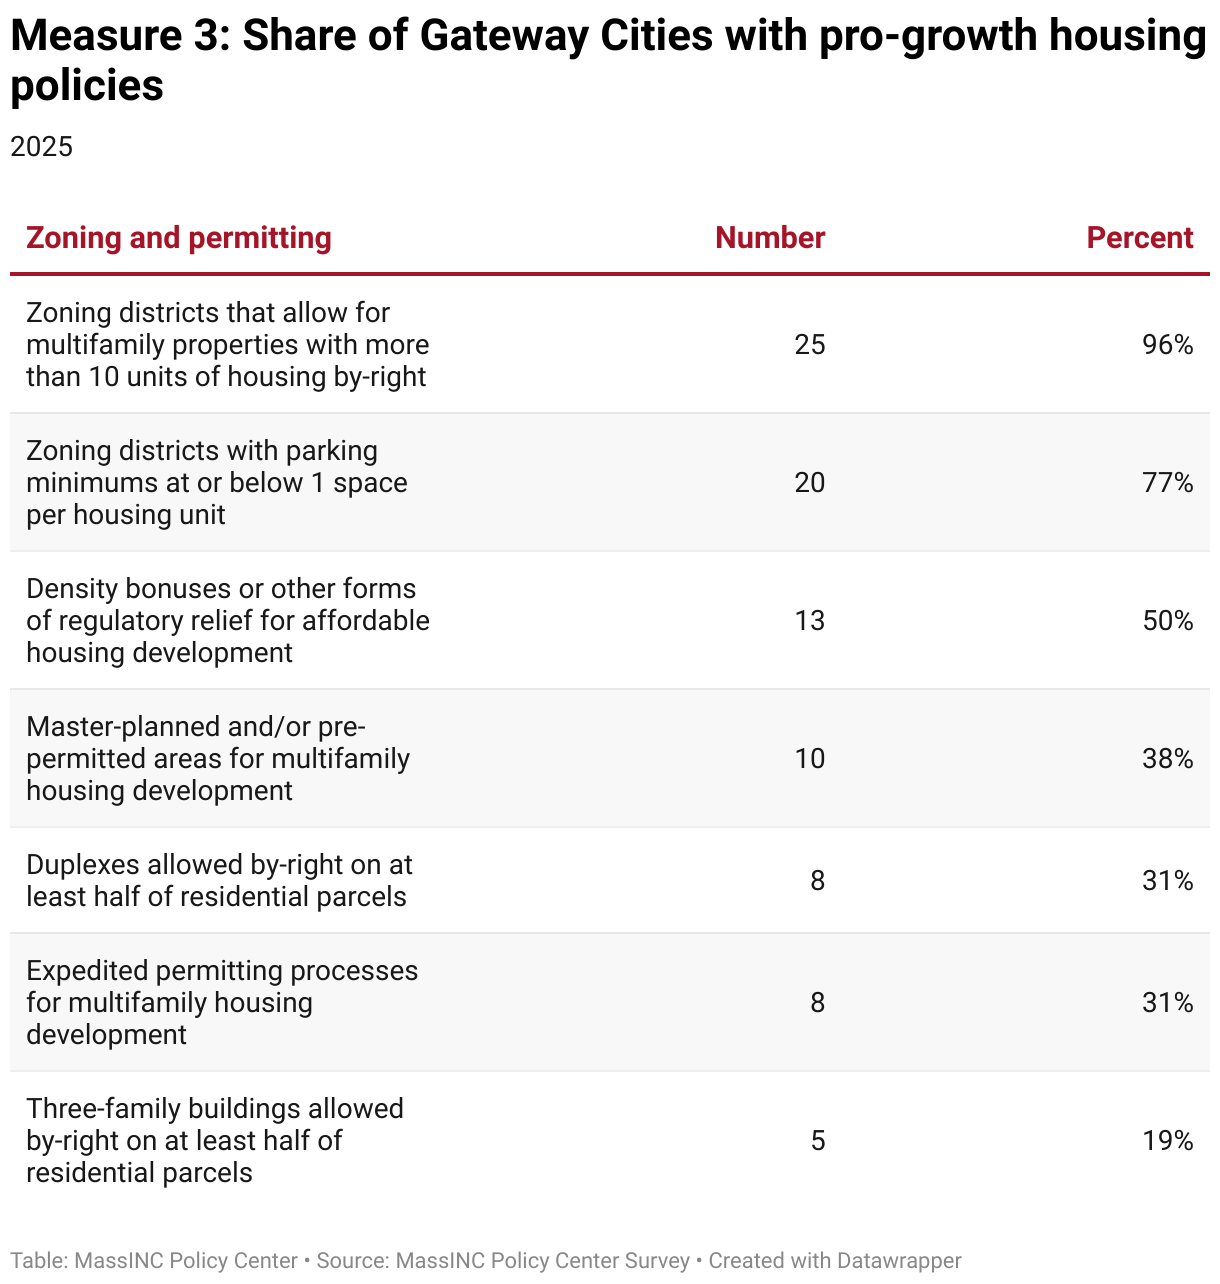
In 2025, the most widely adopted zoning reforms among Gateway Cities are ordinances creating zoning districts that have reducing parking minimums or allow the construction of multifamily housing developments with more than 10 units by-right. More than half of cities now report lower residential parking minimums in some areas, and nearly three-quarters have districts where large multifamily housing development is allowed by-right. Tools that streamline approvals or expand traditional infill housing types—such as expedited permitting and duplexes or triples by-right in the majority of residential areas—remain less common. Many of the gains over the past year likely reflect compliance efforts with the state’s MBTA Communities Act, which requires municipalities served by transit to zone for multifamily housing near stations.
Top performers in 2025 (most positive responses):
- Chelsea (6/7)
- Everett (6/7)
- Quincy (6/7)
Major changes from 2024 to 2025:
- Five cities (Attleboro, Everett, Leominster, New Bedford, and Taunton) created their first zoning districts with reduced parking requirements.
- Four cities (Attleboro, Haverhill, Leominster, and Westfield) created their first zoning districts where multifamily housing developments with more than 10 units are allowed by-right.
- Three cities (Lynn, New Bedford, and Pittsfield) increased the share of parcels on which three-family homes can be built by-right to more than half of all residential parcels.
4. Urban Intensity
Cities can unlock real estate value and make housing development more feasible by creating walkable neighborhoods with reliable transportation. Most Gateway Cities already score “above average” or “most walkable” on the EPA’s National Walkability Index, supporting quality of life with or without cars. But many remain auto-dependent, which makes increasing housing production—and thereby population density—harder because of parking and traffic impacts. This creates a Catch-22: transit investment depends on ridership, yet ridership depends on the very density that transit would help support. This section measures whether Gateway Cities have the population and job density needed to justify expanded public transportation.
What does this measure?
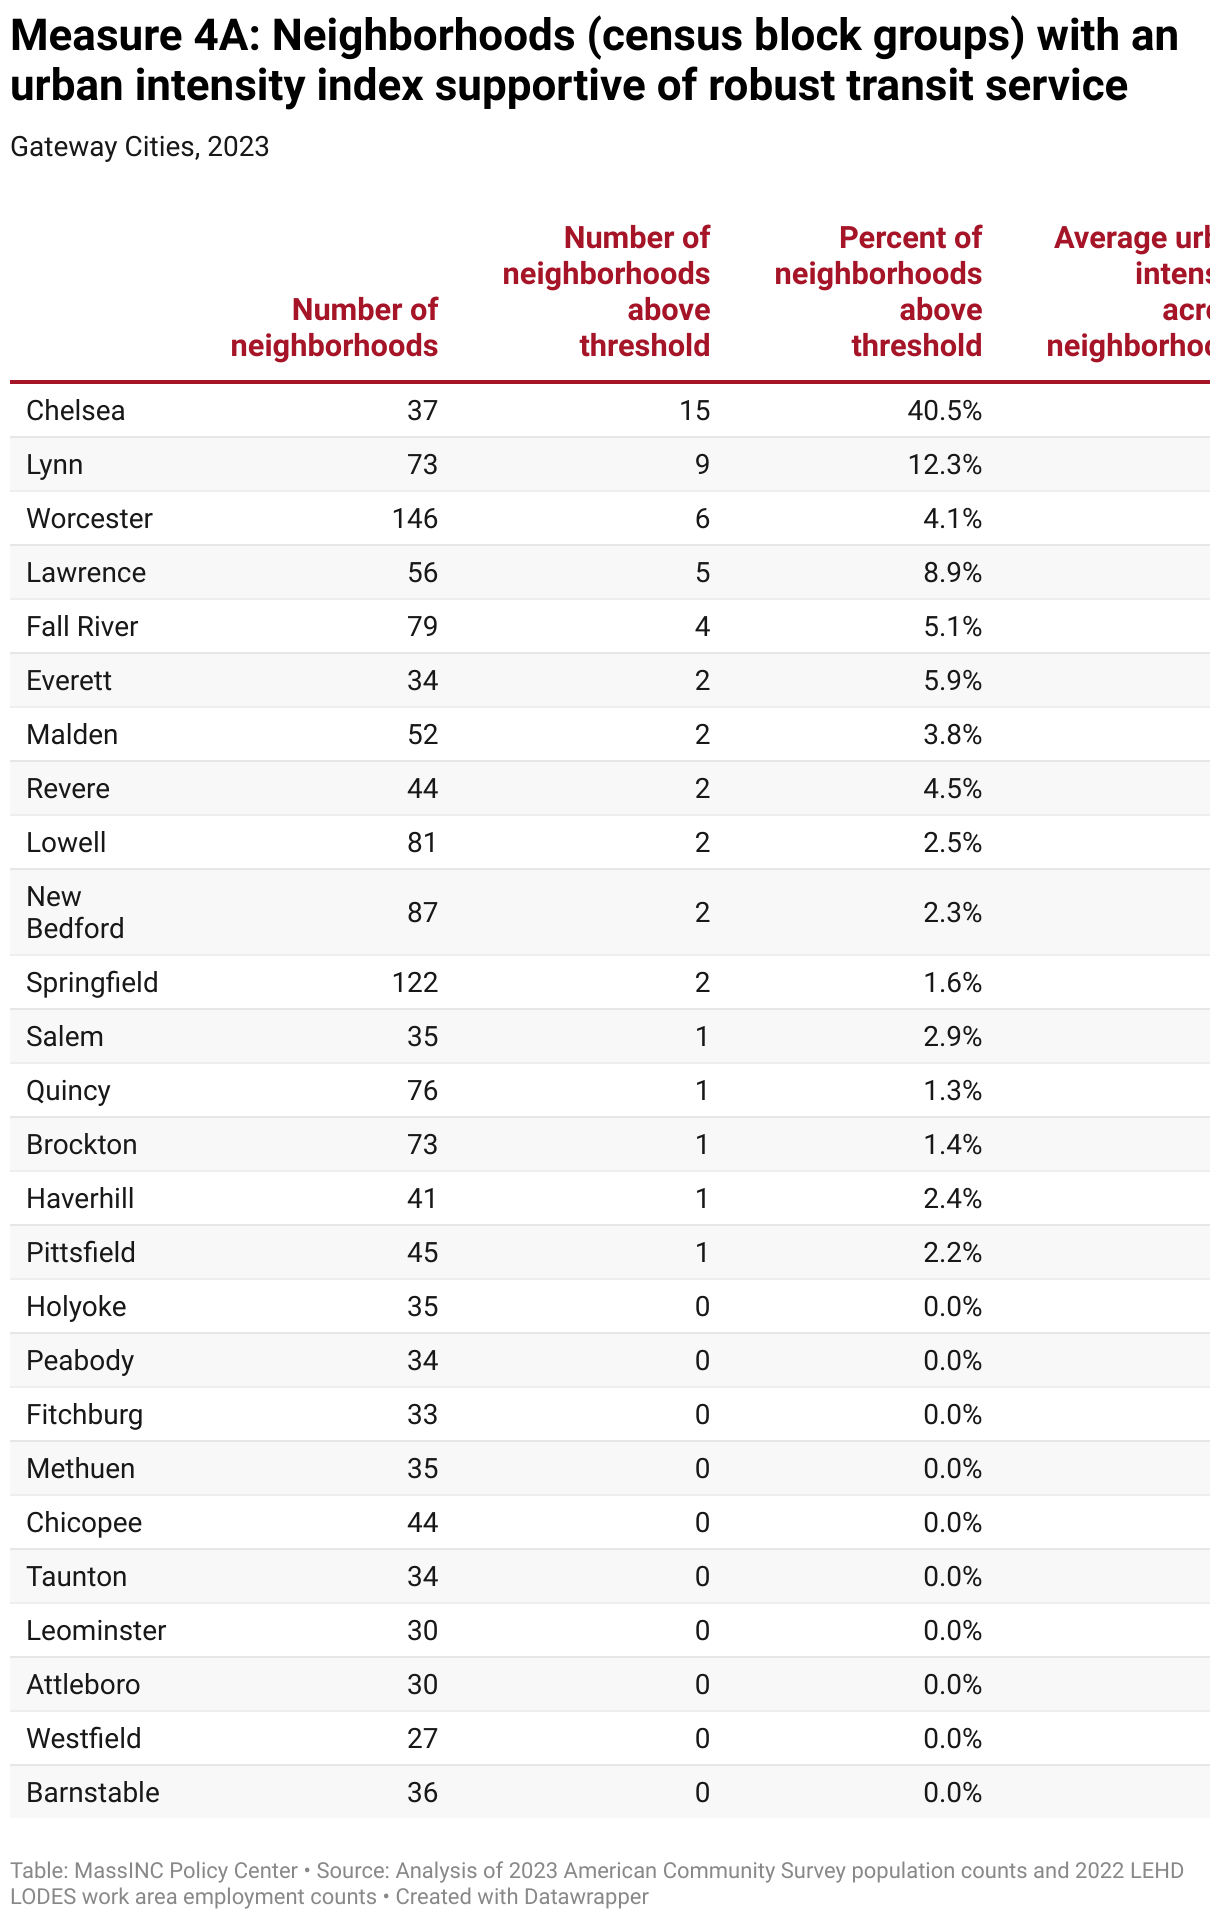
These charts capture how concentrated people and employment are within neighborhoods, a key factor in determining whether an area can generate enough ridership to support high-frequency transit service. To assess this, we combine residents and jobs per acre into an urban intensity index and then calculate what share of census block groups and train-station TOD zones exceed the threshold of 60.
Why is this important?
Urban intensity is the foundation for TOD and sustainable growth. When residents and jobs are clustered in dense mixed-use areas, it is possible to efficiently provide frequent transit service all throughout the day. This increased transit service will in turn increase land values, making additional infill development more economically viable. Higher urban intensity also lowers the per-unit cost of infrastructure and services, which can make business improvement districts and other district management strategies more effective.
Notes about the data
Urban intensity is calculated as residents plus jobs divided by census block group land area. The threshold of an urban intensity index of 60 draws on prior research, as described in the MassINC Policy Center’s 2018 transit-oriented development study. Population counts come from the 2023 American Community Survey (5-year sample). The number of jobs in each census block group are drawn from the 2022 LEHD Origin–Destination Employment Statistics (LODES) Workplace Area Characteristics (WAC) file. Block groups are statistical units, not neighborhoods, so values can vary sharply depending on weather the area includes industrial land, water, or other land uses.
How are Gateway Cities doing?
The benchmark of 60 residents plus jobs per acre is deliberately high—it represents the level of density that can sustain robust, frequent transit service. Encouragingly, many Gateway Cities already have neighborhoods that reach this level. Chelsea stands out, with more than 40 percent of its block groups above the threshold, while Lynn, Lawrence, Everett, and Malden all have several neighborhoods that have already reached healthy transit-supporting densities. Notably, about 40 percent of Gateway City neighborhoods with high urban intensity fall outside of the Greater Boston urban core. Worcester leads this pack with six such neighborhoods.
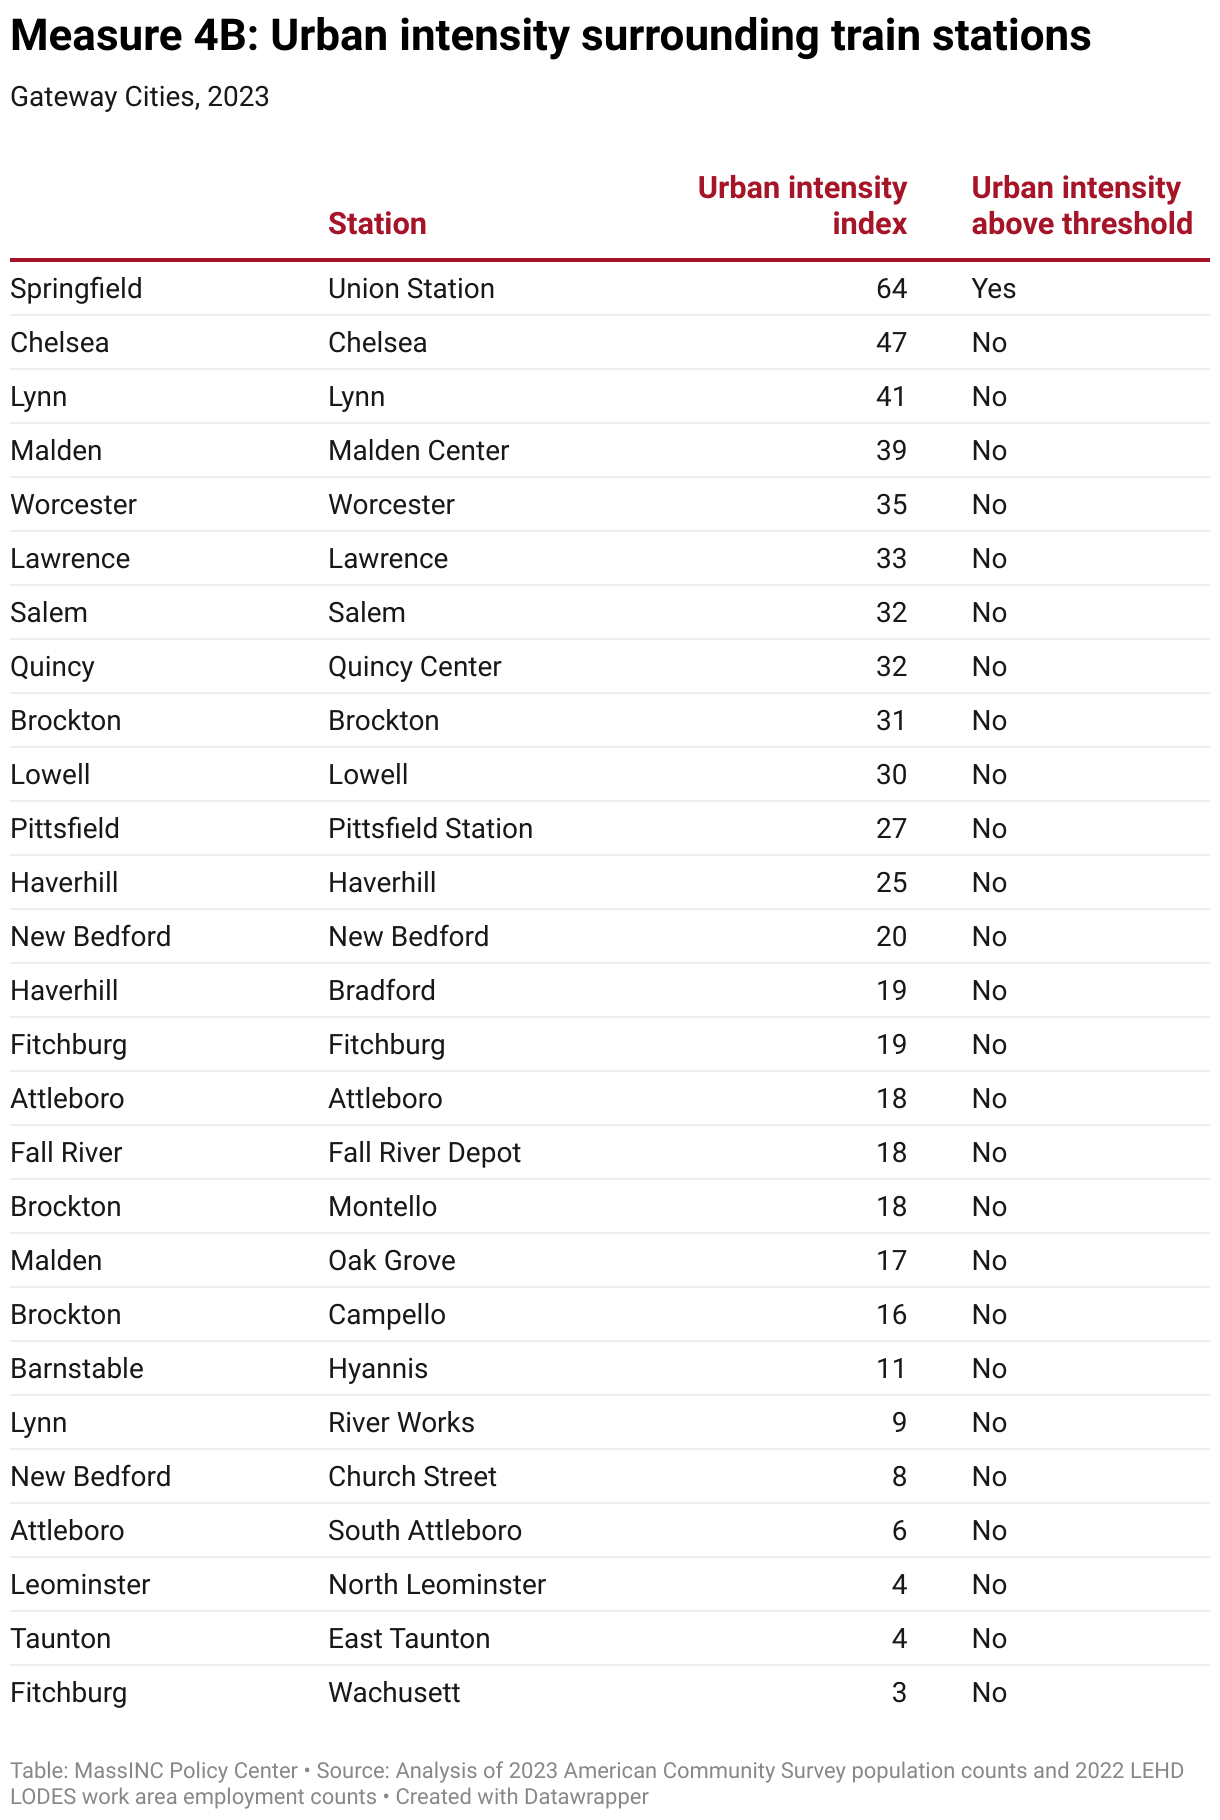
Zooming into the half-mile radius around train stations, only one (Springfield’s Union Station) currently exceeds the 60 residents-plus-jobs-per-acre urban intensity benchmark. A second tier of stations—including Chelsea, Lynn, Malden, Worcester, Lawrence, Salem, Quincy, Brockton, Lowell, Pittsfield, and Haverhill—fall in the 25-to-55 urban intensity range.
Gateway Cities are gaining residents in their station areas through infill development. But most have lost significant downtown employment since the pandemic. As a result, many are struggling to build overall urban intensity levels. Increasing density to support more frequent transit service will require additional residential development and new strategies to bring people back to the office and rebuild the downtown commercial base.
2025 Gateway Cities Housing Monitor
Chapters

2025 Gateway Cities Housing Monitor
September 17, 2025