Gateway Cities neighborhoods are revitalizing, though unevenly.
This chapter assesses the degree to which Gateway City neighborhoods are improving by examining key indicators of economic and community well-being. Neighborhood conditions heavily influence the extent to which Gateway Cities provide a launch pad for upward economic mobility. Taking stock of revitalization at the neighborhood level also provides a gauge of how well positioned these communities are to attract and retain residents, and in turn, play a larger role helping Massachusetts meet its housing needs. Collecting data to accurately detect neighborhood change is difficult. This chapter relies almost exclusively on census figures, which means there is a significant time lag. Still, following these metrics each year in the Housing Monitor will help us identify and call attention to important long-term trends.
Key Findings
As whole, Gateway Cities are stable or improving across a range of neighborhood condition metrics. On average, Gateway City median household incomes are rising slightly relative to the state. The share of Gateway City neighborhoods with concentrated poverty fell from 22 percent in 2013 to 11 percent in 2023. And the share of Gateway City census tracts with clusters of vacant and blighted housing fell from 8.1 percent in 2013 to 6.8 percent in 2023.
Measures of neighborhood health in several Western Massachusetts Gateway Cities continue to present serious concerns. While the number of neighborhoods with concentrated poverty fell slightly over the past decade in Holyoke and Springfield, they are still very prevalent in these communities; one-third of residents in Springfield and one-fifth in Holyoke live in neighborhoods with highly concentrated poverty. In Holyoke and Pittsfield, the number of neighborhoods with vacant and blighted property challenges doubled between 2018 and 2023.
Residential instability is down sharply in most Gateway Cities. While this is very beneficial to neighborhood health, it could be a signal that residents are having more difficulty relocating when needed. The share of Gateway City neighborhoods with high rates of residential instability has fallen from 25 percent in 2013 to 10 percent in 2023. Overall, this trend is a sign that efforts to reduce evictions and preserve tenancies have been enormously successful. However, the reductions are so sharp that they begin to raise questions about whether housing markets have become so tight that Gateway City residents may have difficulty relocating to find jobs or meet other essential needs.
The sections that follow unpack this chapter’s key findings with greater detail on what each measure captures, why it matters, and how Gateway Cities are performing. Each topic can be expanded by clicking on the dropdowns, where you’ll also find notes about the data sources and methods used. Interactive charts allow you to hover over points for additional detail and share snapshots directly to social media. For those who want to dig deeper, the underlying datasets are available to download and explore. Together, these tools provide both a quick overview and a deeper dive into housing affordability in Gateway Cities.
1. Household Income Compared to the State Median
What does this measure?
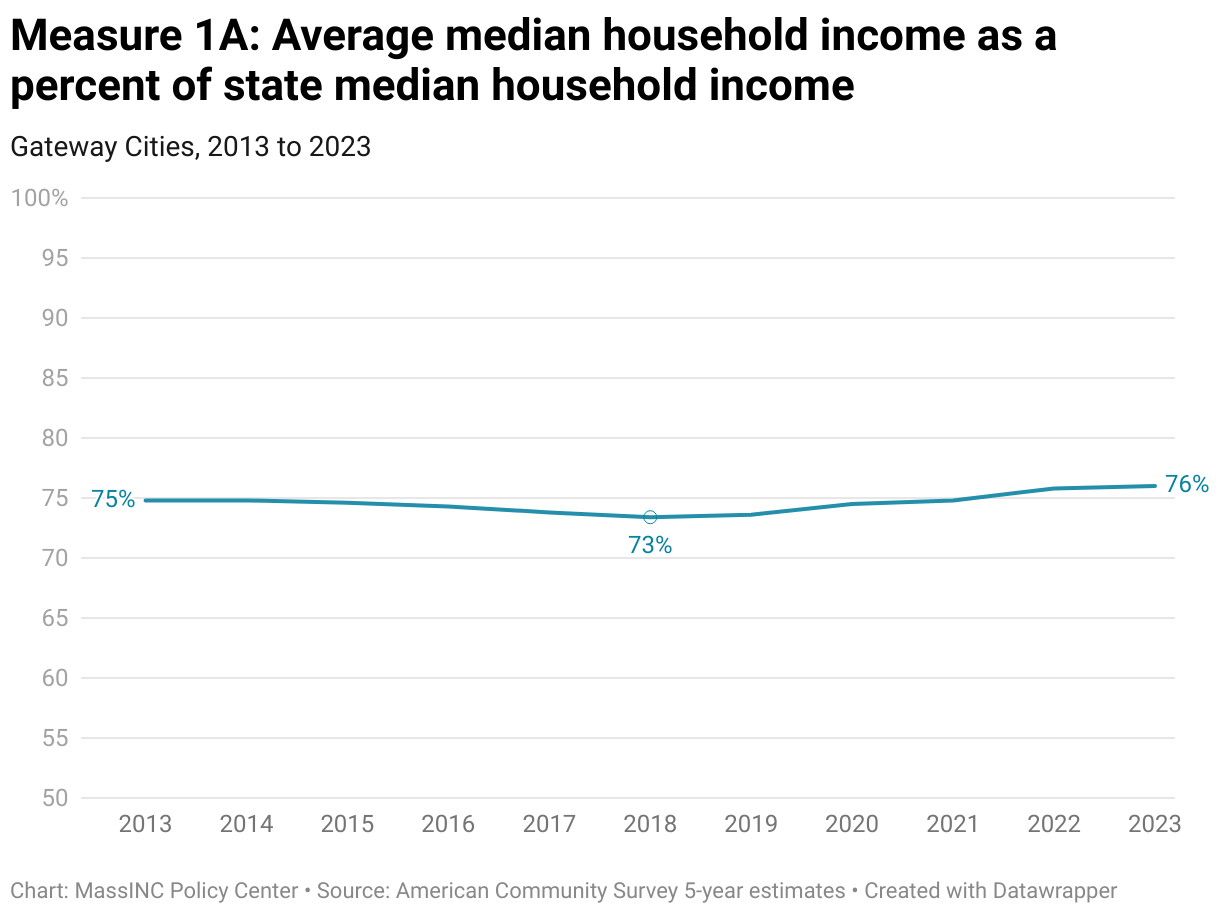
This measure uses data from the American Community Survey (ACS) to track the median household income in Gateway Cities as a percent of the statewide median household income.
Why is this important?
While this is a city-level measure, it provides a starting point for monitoring community economic well-being. If the median incomes in Gateway Cities are increasing relative to the overall state median, it could be a sign that higher-income households are moving to these communities, raising concerns about displacement. However, increases in this metric could also reflect other economic forces that lead to disproportionate income gains for incumbent Gateway City residents. For instance, if these cities are home to a large number of service workers, and wages for this sector rise at a faster pace than wage increases in the overall Massachusetts economy, then the median income will grow faster for Gateway Cities relative to the state.
Notes about the data
These estimates come from the US Census Bureau’s American Community Survey (ACS). ACS produces both 1-year and 5-year estimates, but 1-year data are only available for geographies with populations above 65,000. Since many Gateway Cities are below this threshold, 5-year estimates must be used for this analysis. Five-year estimates average data collected over multiple years. This smooths out short-term changes and makes these estimates better suited for tracking longer-term patterns.
How are the Gateway Cities doing?
From 2013 to 2018, income fell relative to the state average by 1.4 percentage points, but Gateway City median household incomes rebounded relative to the state from 2018 to 2023, gaining back 2.6 percentage points. The difference between average Gateway City median household income and state median household income is now at a 10-year low.
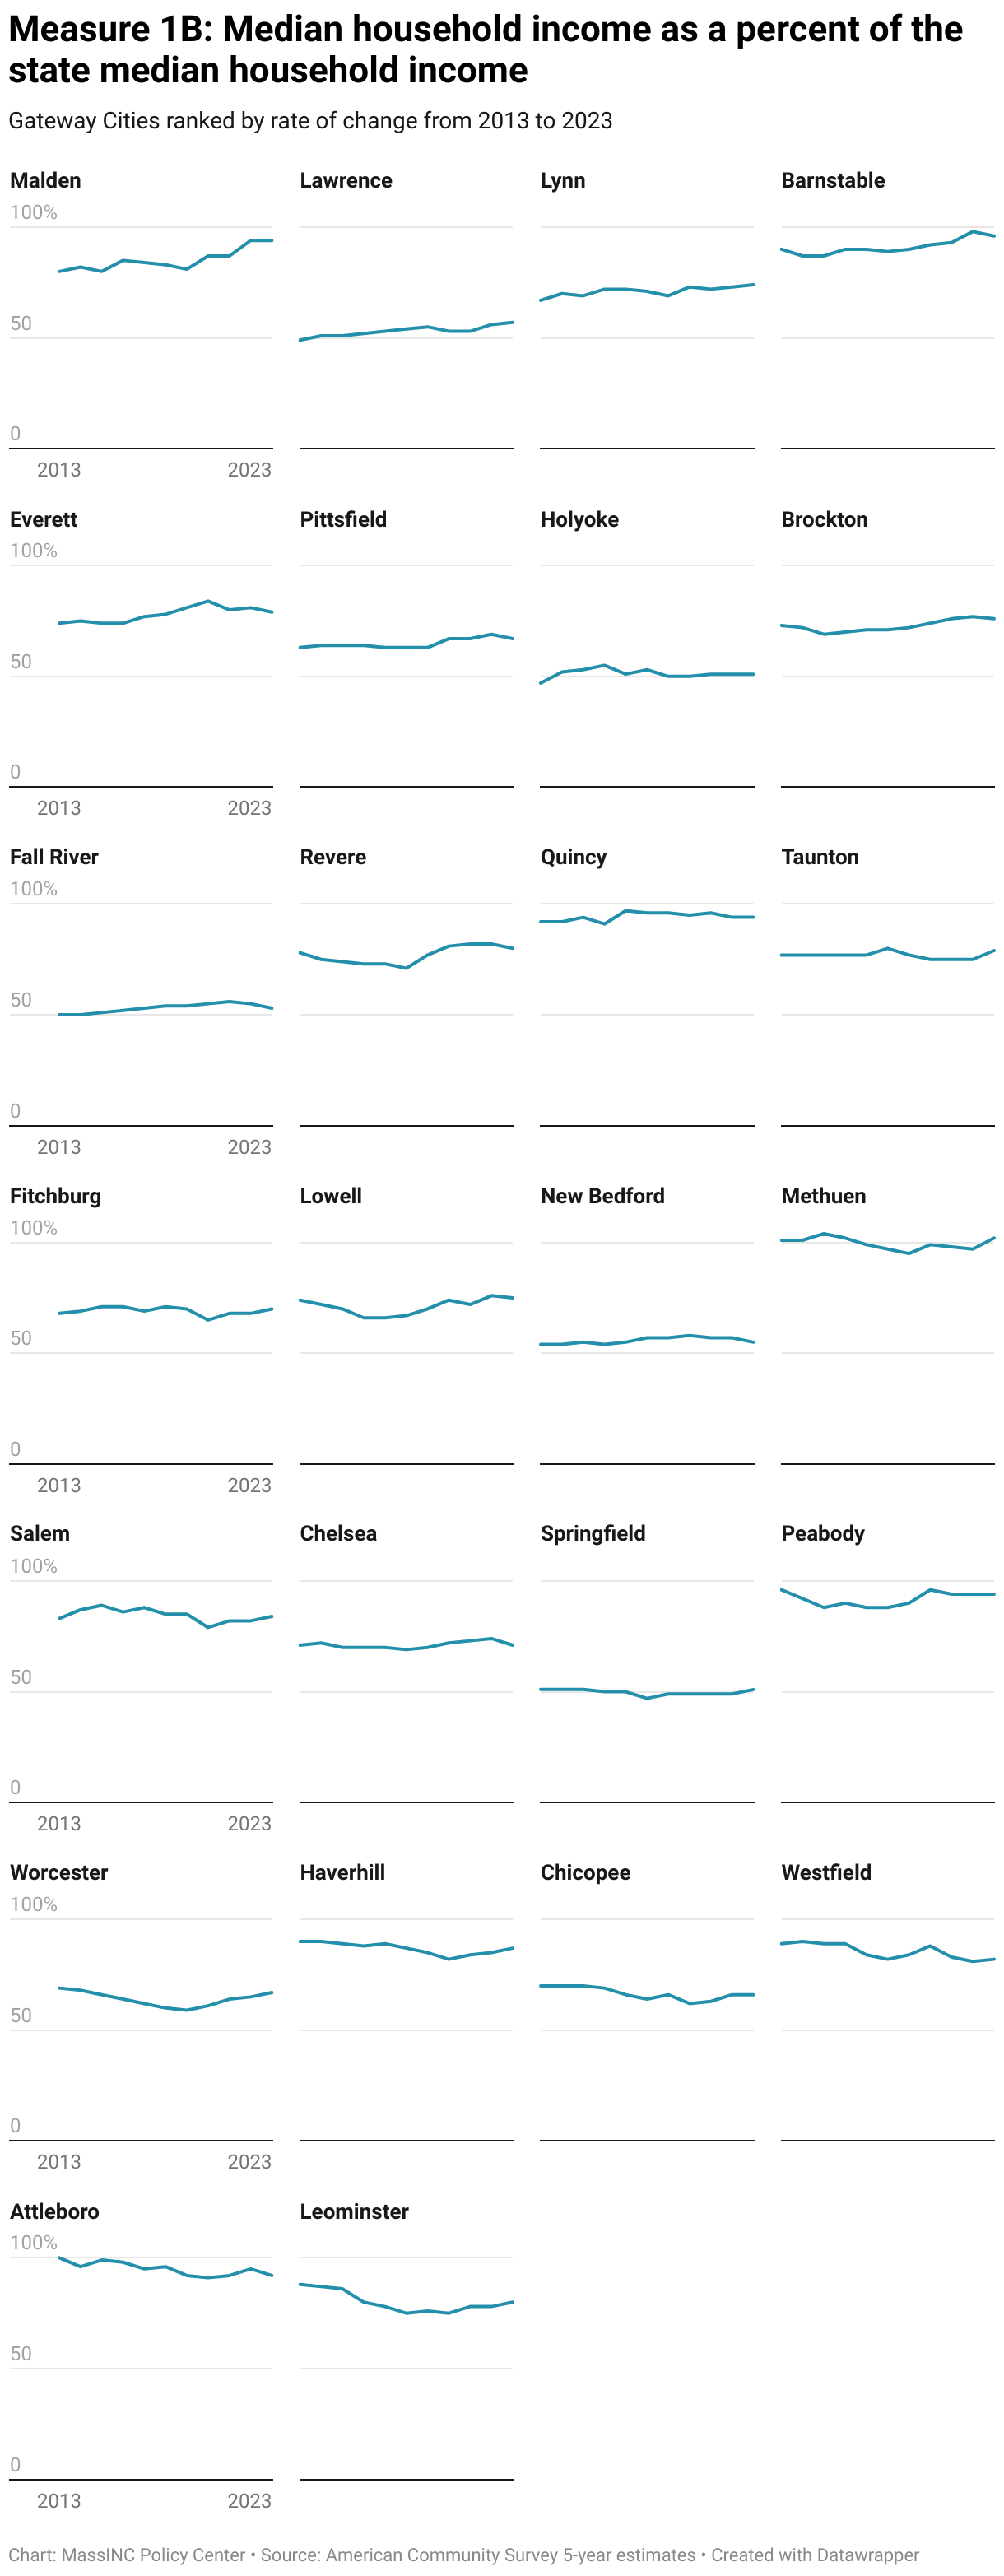
Across the Gateway Cities, there have been no abrupt changes in recent years. Places that have been trending up are still trending up, and places that were stable or declining remain on those paths. Looking long term, however, there are noticeable changes among some Gateway Cities. Over the past 10 years, Attleboro, Leominster, and Westfield fell further behind the state median income by more than 7 percentage points. Conversely, income rose significantly in Barnstable, Lynn, Lawrence, and Malden, closing the difference with the state by 7 to 11 percentage points. Importantly, the income gains in these cities could indicate some degree of displacement of lower- and middle-income residents by relatively higher-income households.
2. Concentrated Poverty
What does this measure?
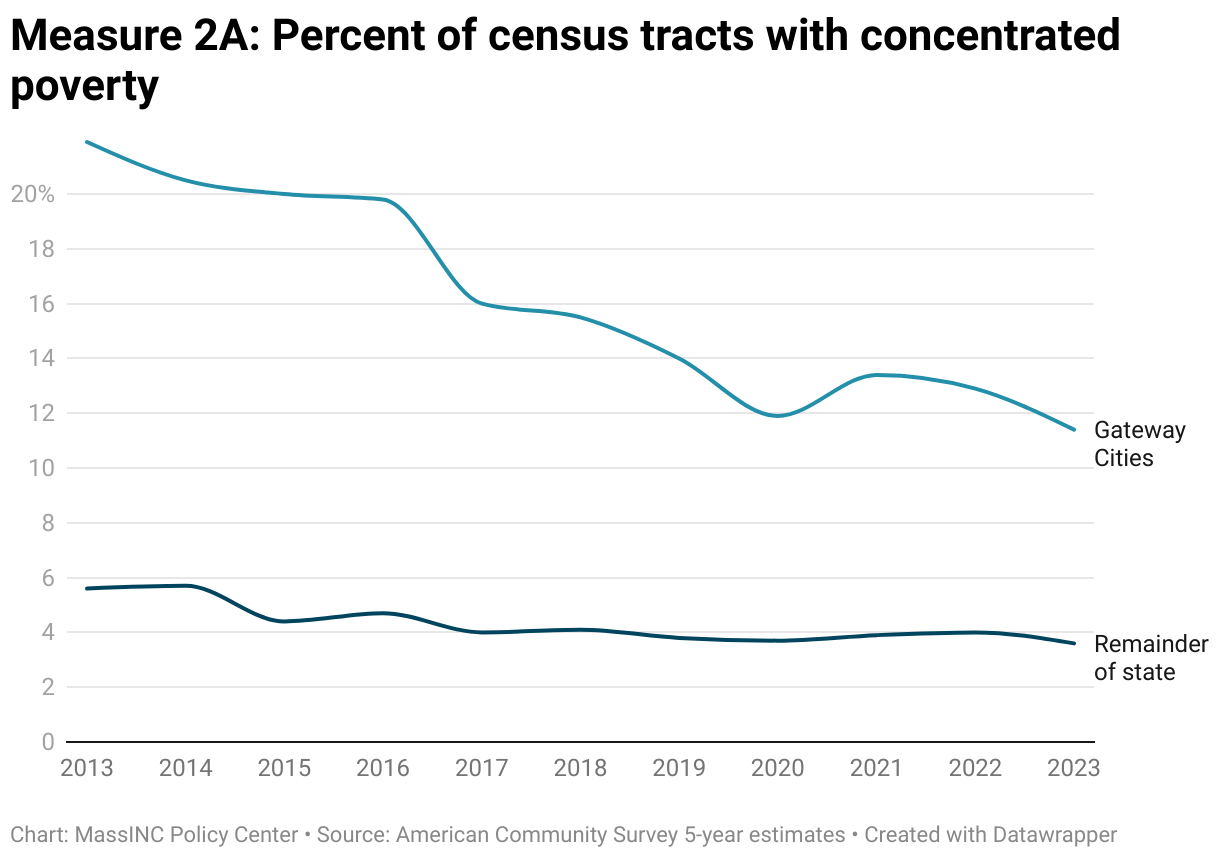
This measure uses data from the American Community Survey (ACS) to track the number of neighborhoods (census tracts) in which the poverty rate exceeds 30 percent.
Why is this important?
With intensifying economic segregation over the last several decades, high concentrations of poverty in urban neighborhoods have become an increasing concern. Research suggests that residents of neighborhoods with poverty rates over 30 percent suffer harms, including reduced academic achievement, lower upward economic mobility, and poorer health and well-being, even if they themselves are not poor.1
Notes about the data
The official federal poverty measure is based only on the cost of food. To the extent that other costs put pressure on household budgets, it is possible that the hardships residents face are increasing even while the poverty rate is declining. This divergence is particularly likely in states like Massachusetts, where housing and energy costs make it more difficult for households to meet basic needs.
Neighborhoods are defined as census tracts, which are drawn to cover a standard population size. However, they vary in land area depending on population density. These estimates come from the US Census Bureau’s American Community Survey (ACS) 5-year estimates. Five-year estimates average data collected over multiple years. This smooths out short-term changes and makes these estimates better suited for tracking longer-term patterns.
How are the Gateway Cities doing?
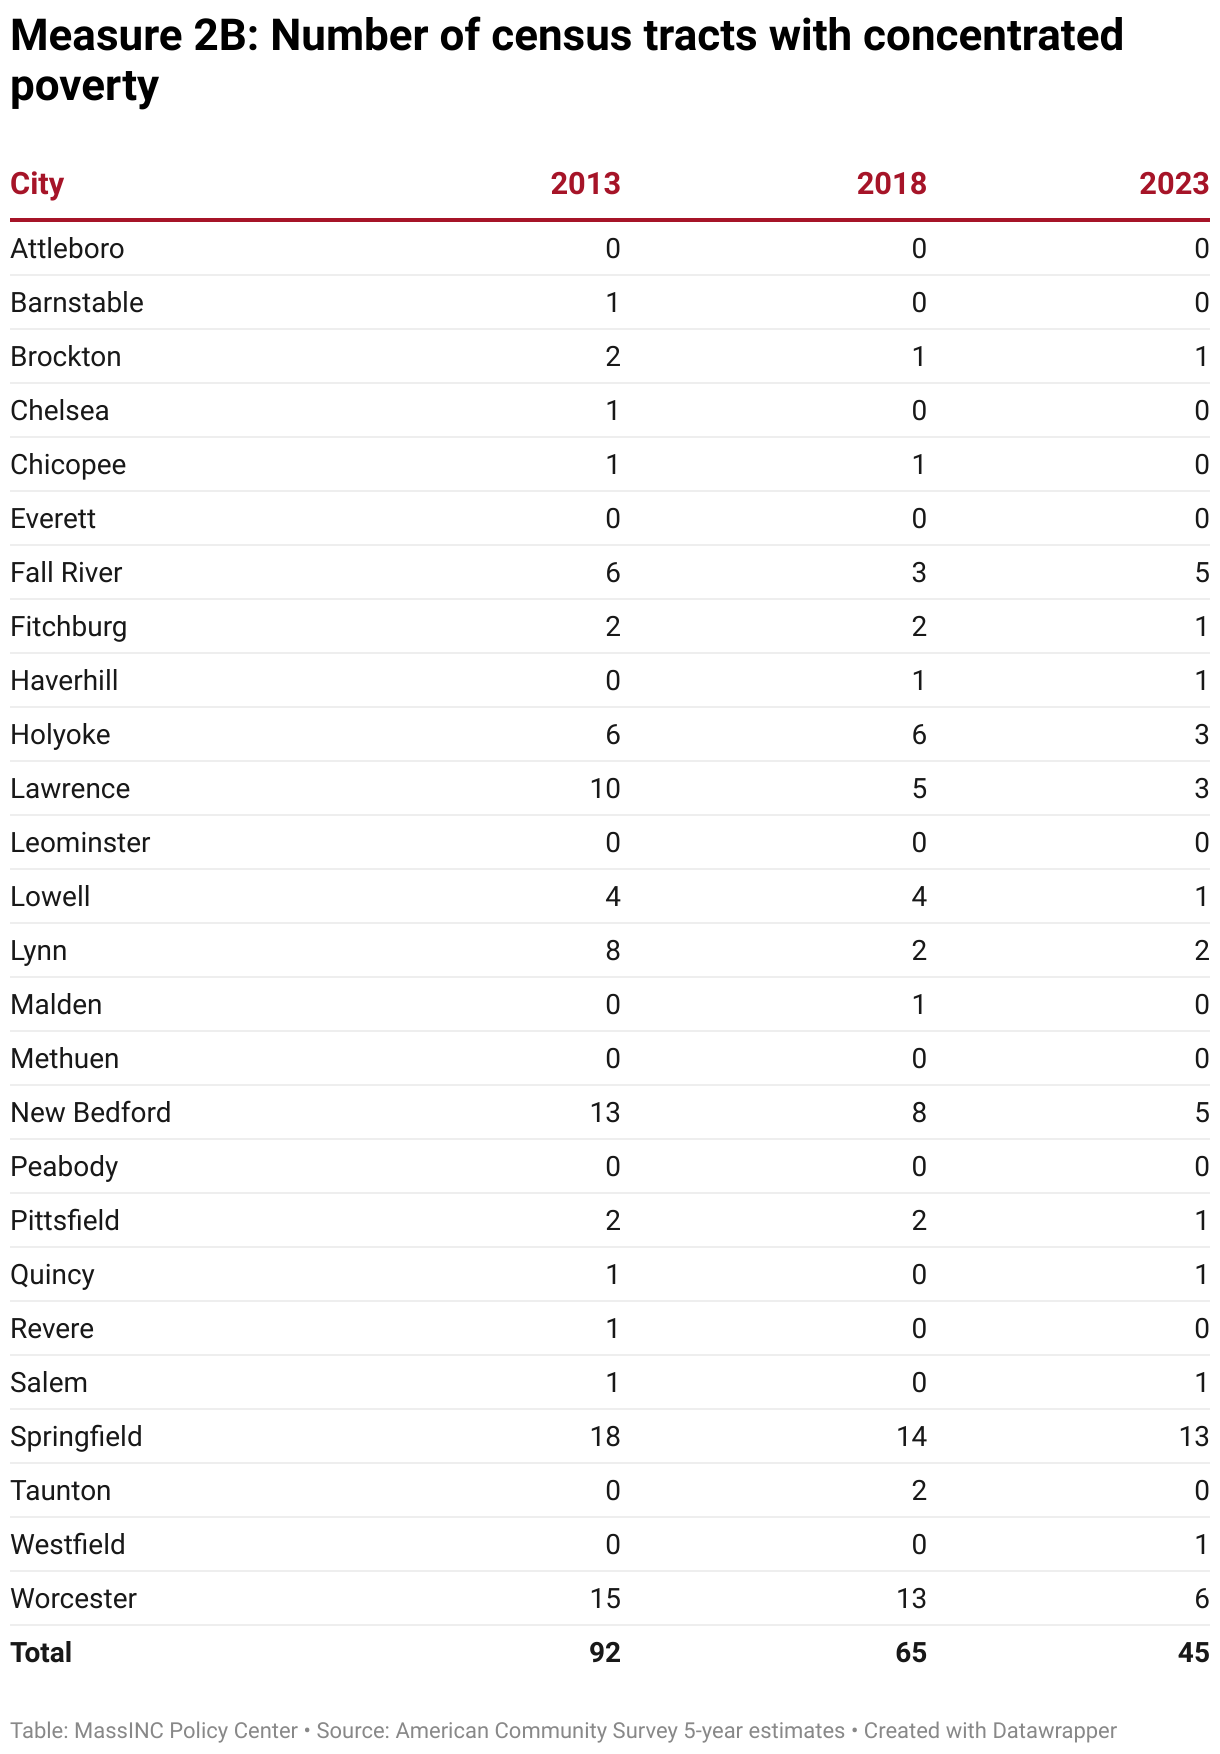
From 2013 to 2023, the share of census tracts in Gateway Cities with concentrated poverty fell from 22 percent to 11 percent—a historic improvement that cut the prevalence of concentrated poverty in half. Yet even with this progress, Gateway Cities continue to face much higher levels of concentrated disadvantage than the rest of Massachusetts, where less than 4 percent of tracts were above the 30-percent poverty threshold in 2023. This stark difference underscores how residential segregation by income remains a defining challenge for Gateway Cities.
It is notable that after stagnating in 2021 and 2022, the five-year rolling average continued its downward trajectory in 2023. Still, 158,000 Gateway City residents live in neighborhoods with poverty rates over 30 percent.
Springfield, Worcester, Fall River, and New Bedford each continue to have five or more high-poverty neighborhoods. In Springfield, about one in three residents live in neighborhoods with concentrated poverty; in Holyoke and Fall River, it is about one in five. Worcester, New Bedford, Lawrence, and Lynn distinguished themselves by achieving the greatest reductions in the number of high-poverty neighborhoods between 2013 and 2023.
3. Residential Stability
What does this measure?
This indicator tracks neighborhood stability using data from the American Community Survey (ACS) to identify neighborhoods in which more than one-fifth of residents had moved within the past 12 months. They are referred to here as high-churn neighborhoods. Neighborhoods themselves are defined using census tracts, which are drawn to cover a standard population size but therefore vary in geographic area depending on density.
Why is this important?
High residential turnover can be disruptive for families, especially when frequent moves make it harder to build stable support networks and interrupt schooling for children. These disruptions accumulate at the neighborhood level, where constant turnover weakens social ties, reduces civic engagement, and can contribute to higher crime. Schools in particular struggle when many students are coming and going, making it difficult to maintain continuity of instruction. While some neighborhoods naturally experience higher churn—such as those with large college student populations—instability can be a signal of deeper social or economic challenges.
Notes about the data
Neighborhoods are defined as census tracts, which are drawn to cover a standard population size. However, they vary in land area depending on population density. These estimates come from the U.S. Census Bureau’s American Community Survey (ACS) 5-year estimates. Five-year estimates average data collected over multiple years. This smooths out short-term changes and makes these estimates better suited for tracking longer-term patterns.
How are Gateway Cities doing?
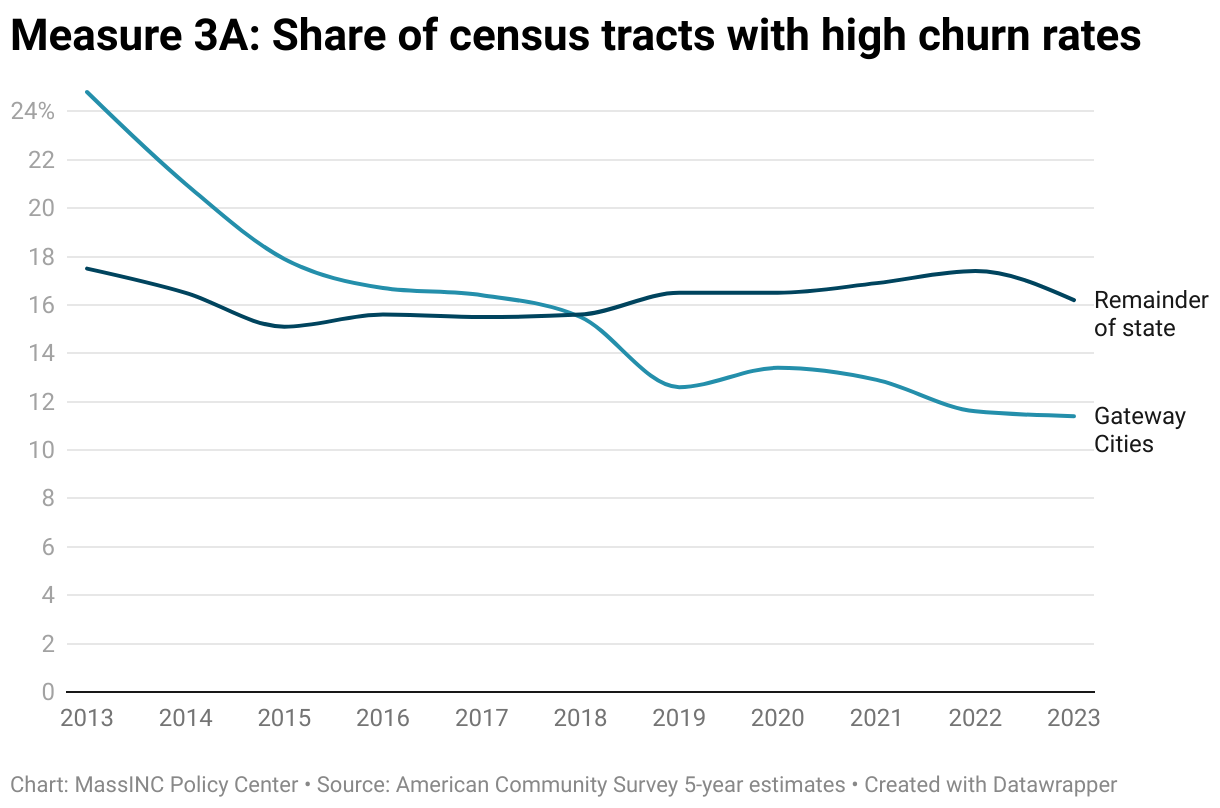
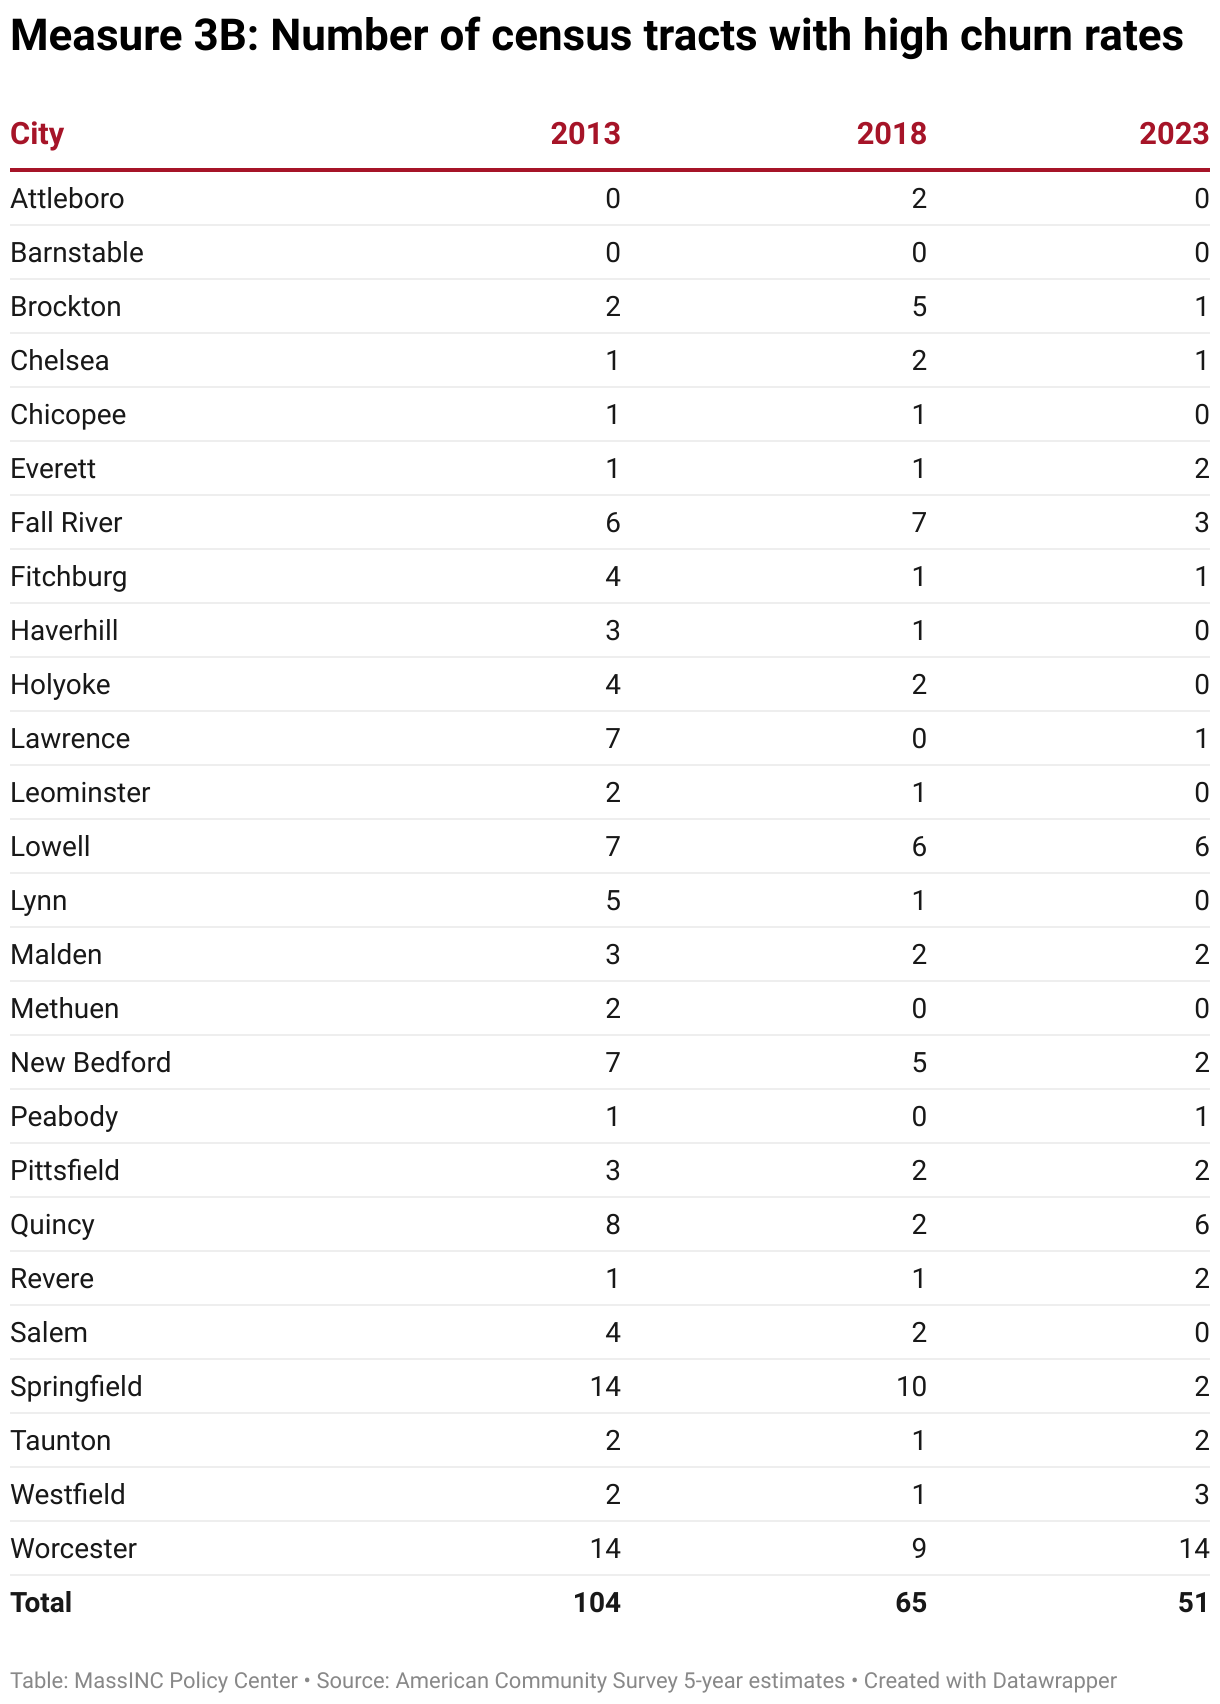
Across Gateway Cities, the share of census tracts where more than one-fifth of residents had moved within the past 12 months has fallen steadily, from 25 percent in 2013 to 10 percent in 2023. Similarly, the number of Gateway Cities with at least one of these high-churn neighborhoods fell from 24 to 17.
In several Gateway Cities, the number of high-churn neighborhoods fell to zero, including Chicopee, Haverhill, Leominster, Lynn, and Salem. Holyoke, Salem, Lawrence, and Springfield have seen the most dramatic reduction. In these cities, more than one-third of census tracts had high churn rates in 2013, and now just 4 percent do.
In a few Gateway Cities, the number of high-churn neighborhoods is actually higher in 2023 than in prior years. These include Everett, Revere, and Westfield. For Everett and Revere, it is likely that rising rents are leading to displacement pressure, while the persistently high churn in Westfield is likely related to its large college student population.
Starting in 2018, Gateway Cities as a group have had a lower prevalence of high-churn census tracts than the remainder of the state. But non-Gateway City census tracts with high residential turnover are generally well-known college towns, or neighborhoods of Greater Boston with proximity to colleges and teaching hospitals. Places with the highest churn rates outside of the Gateway Cities include Amherst, Williamstown, Cambridge, South Hadley, Somerville, Brookline, and Boston.
4. Vacant and Blighted Property
What does this measure?
This measure tracks “hypervacancy” in Massachusetts neighborhoods—census tracts with unusually high rates of long-term vacant properties. Following research by Austin Harrison and Dan Immergluck, neighborhoods are flagged when more than 8 percent of their housing units fall into the Census Bureau’s “other vacant” category. These are units that are empty but not on the market for rent or sale, often signaling that they are in poor condition or otherwise removed from productive use.2
Why is this important?
Elevated levels of “other vacant” housing are widely interpreted as a sign of neighborhood distress. When vacancy rates rise above the 8 percent threshold for a neighborhood, studies suggest the effects ripple outward—eroding public health and safety, dragging down neighboring property values, and straining municipal finances through lost tax revenue and higher service costs.
Notes about the data
Neighborhoods are defined as census tracts, which are drawn to cover a standard population size. However, they vary in land area depending on population density. These estimates come from the U.S. Census Bureau’s American Community Survey (ACS) 5-year estimates. Five-year estimates average data collected over multiple years. This smooths out short-term changes and makes these estimates best suited for tracking longer-term patterns.
How are Gateway Cities doing?
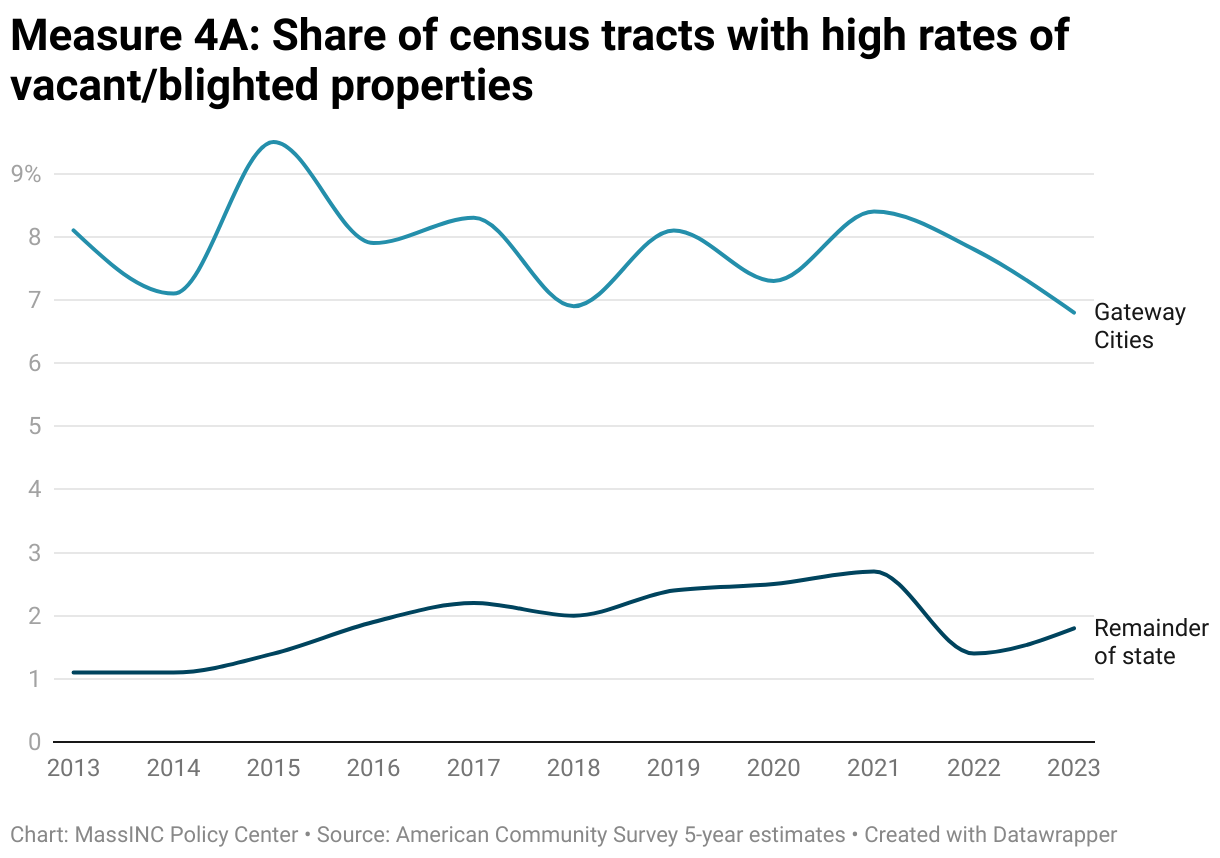
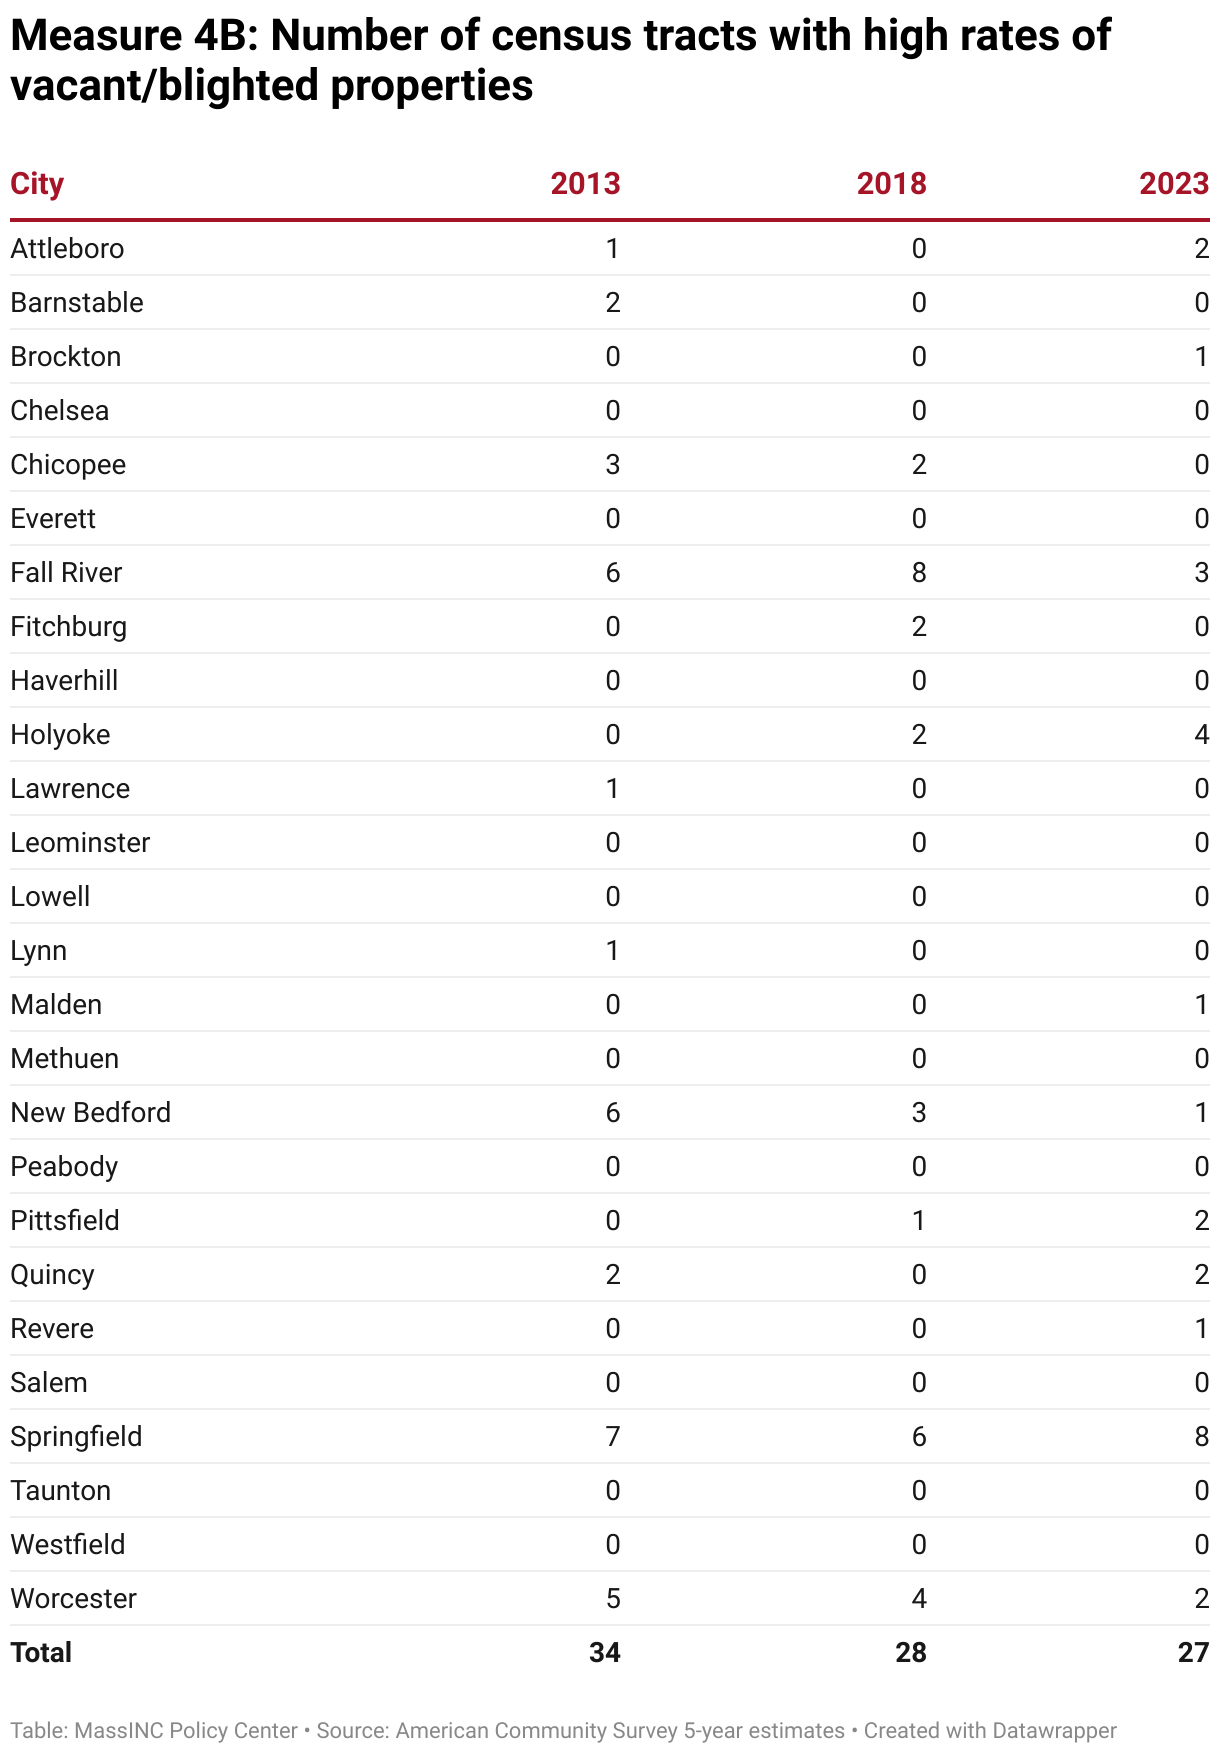
The share of Gateway City census tracts where more than 8 percent of housing structures are long-term vacant fell from 8.1 percent in 2013 to 6.8 percent in 2023.
New Bedford made consistent progress on this measure between 2013 and 2023, reducing the number of high-vacancy tracts from 6 (19 percent of tracts) to 1 (3 percent of tracts). While Chicopee also experienced a large improvement, going from 3 census tracts (25 percent of tracts) in 2013 to zero in 2023, other Western Massachusetts Gateway Cities are struggling. In Springfield, which previously had shown marked improvement from the peak of the foreclosure crisis, the number of high-vacancy tracts increased from 6 in 2018 to 8 in 2023. Over this five-year stretch, the number of high-vacancy tracks doubled in both Holyoke (2 to 4) and Pittsfield (1 to 2).
5. Commercial Vacancy Rates
What does this measure?
This measure tracks vacancy rates in commercial spaces—stores, offices, and other business addresses—as reported by the US Postal Service (USPS) and aggregated by the US Department of Housing and Urban Development. USPS letter carriers flag these addresses as “vacant” when mail is undeliverable for a sustained period. Because business space is highly sensitive to changes in local demand, vacancy rates can shift quickly in response to broader economic conditions, shifts in consumer spending habits, or changes in local population density.
Why is this important?
A large residential base with disposable income supports local businesses, while a diverse mix of businesses makes communities more attractive places to live. This mutually reinforcing cycle sustains vibrancy and quality of life. Conversely, persistently high commercial vacancy weakens neighborhood economies, leaves empty storefronts that undermine perceptions of safety and stability, and reduces the property tax base needed to support local services. While some level of vacancy—around 10 percent—is typical in a balanced market, rates well above this threshold can signal structural challenges in local commercial real estate.
Notes about the data
This measure reflects whether mail is deliverable to a business address, not whether a unit is actively leased or the physical condition of the property. Temporary closures (e.g., renovations) may be recorded as vacancies and lags in updating USPS records may lead to misclassification.
How are Gateway Cities doing?
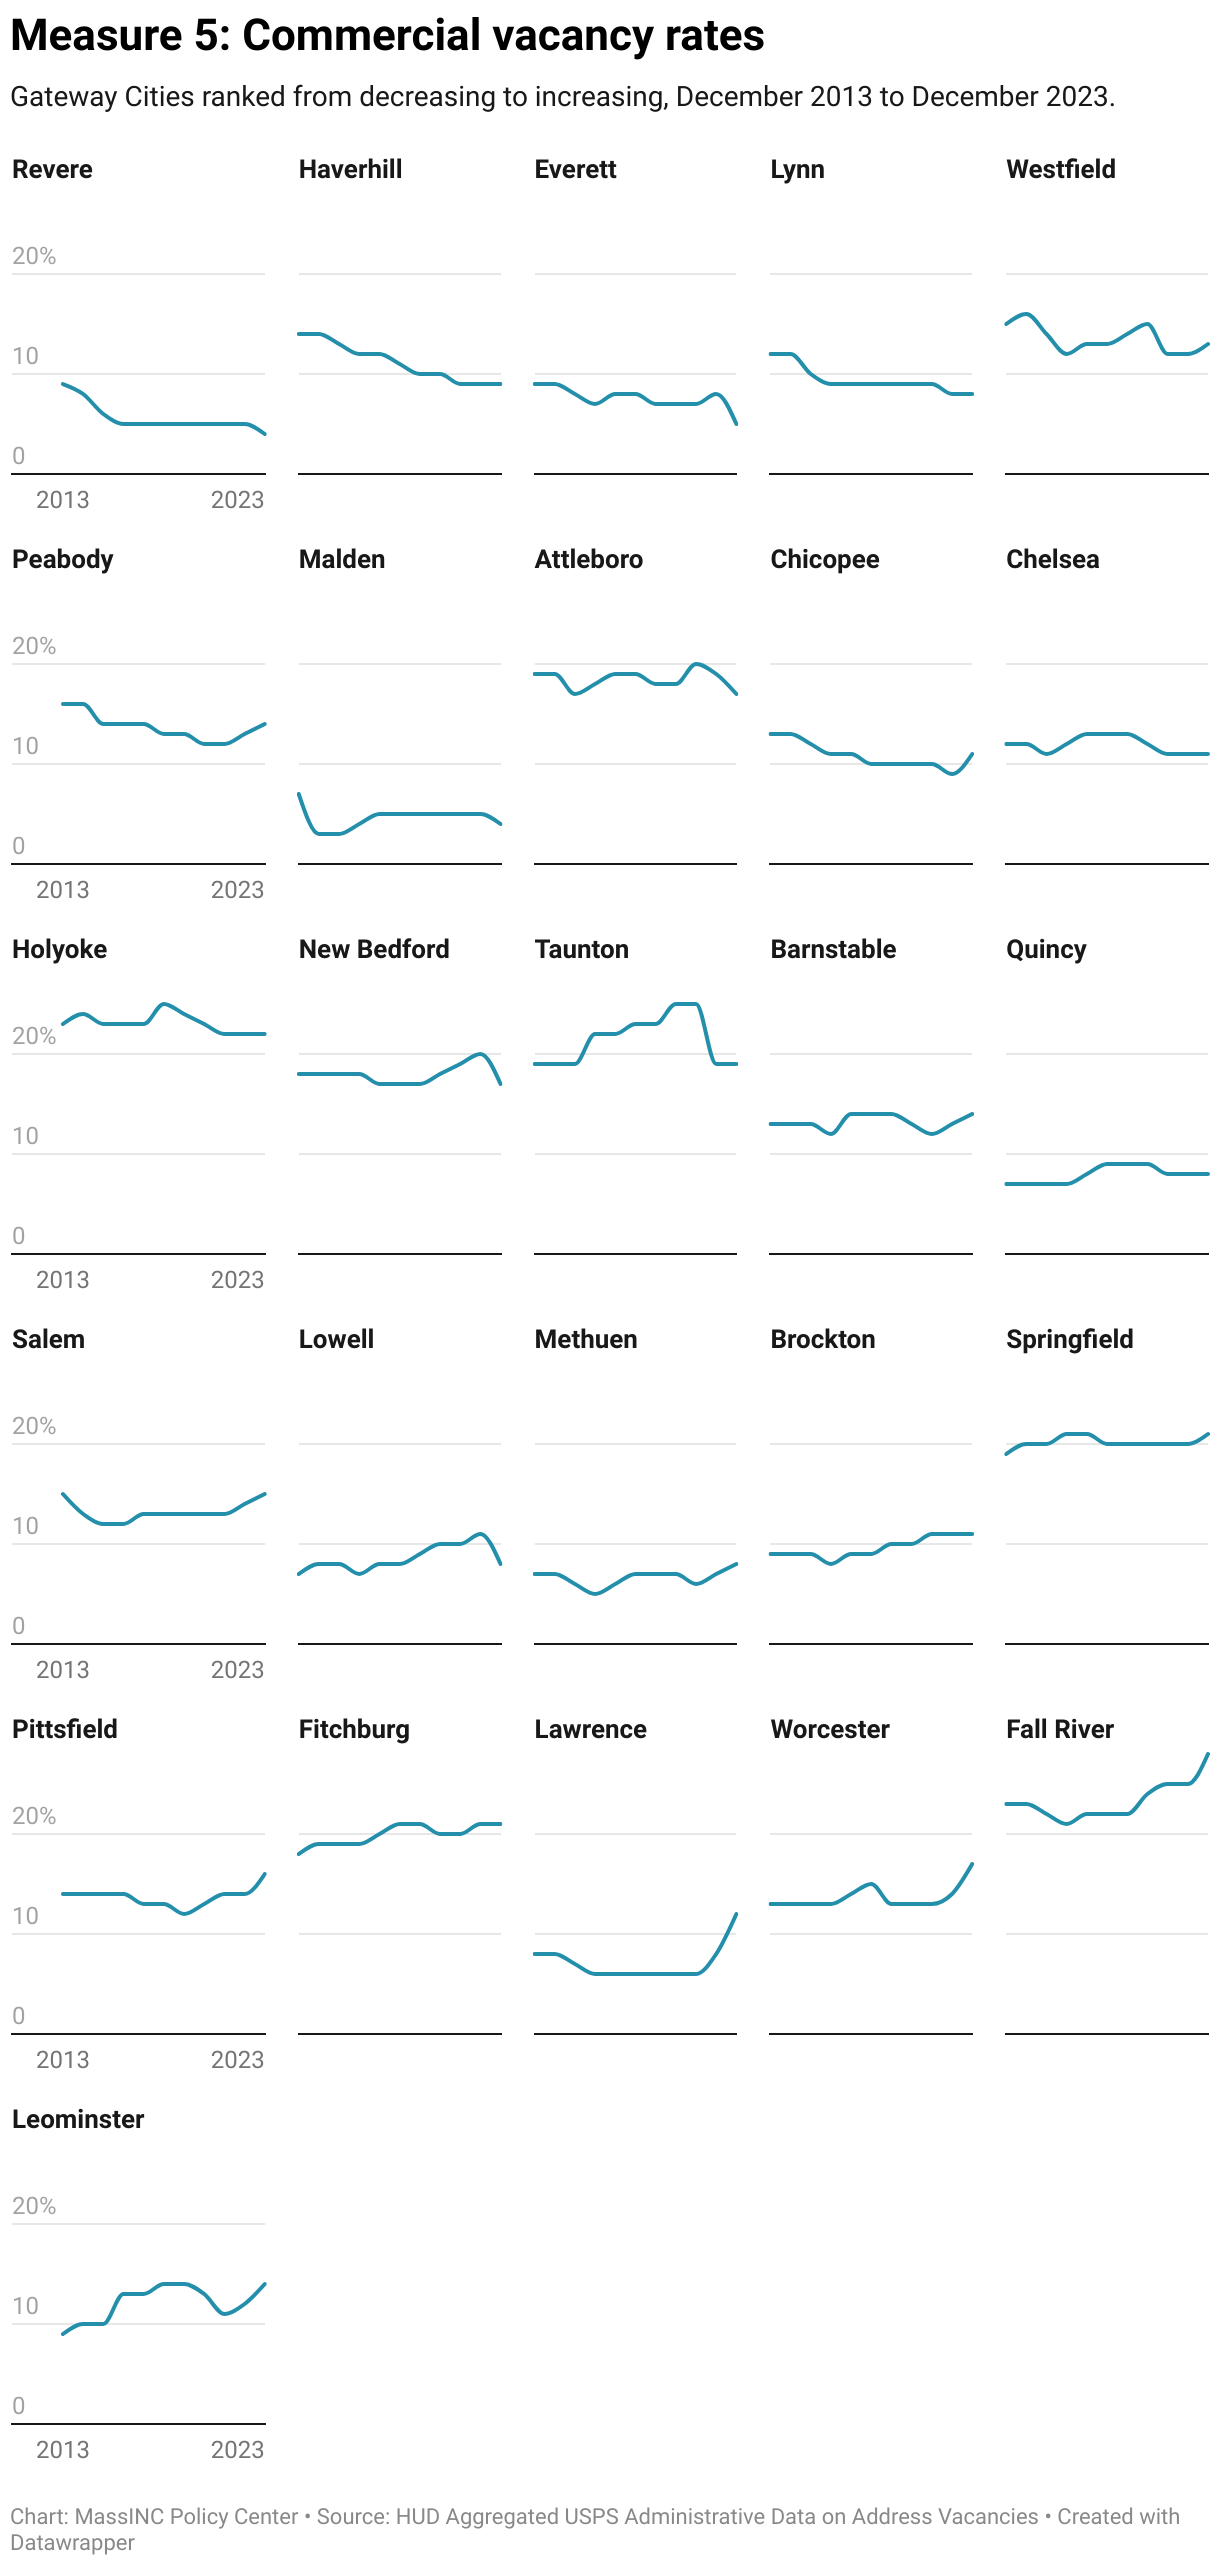
The Gateway City average was essentially unchanged from 2013 to 2023, remaining at around 13 percent. However, this average hides a great deal of variation in commercial vacancy rates across Gateway Cities. In 2023, 16 of the 26 Gateway Cities had commercial vacancy rates above 10 percent, and 10 cities had rates above 15 percent. Meanwhile, commercial vacancy rates were very low and falling in the Gateway Cities closest to Boston (Everett, Malden, and Revere).
Several Gateway Cities experienced a large one-year increase in commercial vacancy rates from 2022 to 2023. These include Lawrence, Worcester, and Leominster, where vacancy rates increased by more than 3 percentage points. Only in Lawrence could this be partially attributed to an increase in the number of business addresses overall, suggesting some vacancy created by new construction. For both Leominster and Worcester, the increase in the vacancy rate was compounded by contraction in the total number of business locations, indicating that the commercial real estate market is adjusting through downsizes and conversions.
- See Elizabeth Kneebone. “The Growth and Spread of Concentrated Poverty, 2000 to 2008-2012.” (Washington, DC: The Brookings Institution, 2014). Paul Taylor and Richard Allan Fry. “The Rise of Residential Segregation by Income.” (Washington, DC; Pew Research Center, 2012. ↩︎
- Harrison, Austin, and Dan Immergluck. “Housing vacancy and hypervacant neighborhoods: Uneven recovery after the US foreclosure crisis.” Journal of Urban Affairs 45.8 (2023). ↩︎
2025 Gateway Cities Housing Monitor
Chapters
Chapter 1: Housing Production and Supply
Chapter 2: Housing Affordability
Chapter 3: Conditions for Growth
Chapter 4: Neighborhood Revitalization

2025 Gateway Cities Housing Monitor
September 17, 2025