
Slight increases in homeowners of color are overshadowed by declining homeownership overall and mounting displacement pressures.
This chapter delves into the critical question of whether revitalization in Gateway Cities is benefiting all residents. We examine trends in homeownership and home appreciation at the neighborhood level, including variation by race and ethnicity. We also explore the markers of gentrification, testing assumptions about the relationship between revitalization and displacement. By analyzing and drawing attention to these dynamics, we hope to help communities develop their neighborhoods in a manner that generates equitable benefits.
Key Findings
Less than half of Gateway City residents own their homes, and the number of rental units is increasing faster than ownership units. From 2013 to 2023, growth in renter-occupied housing in Gateway Cities outpaced growth in owner-occupied housing by 4,200 units. This shift pushed the overall balance from a slight majority of owner-occupants in 2013 to a slight majority of renter households in 2023.
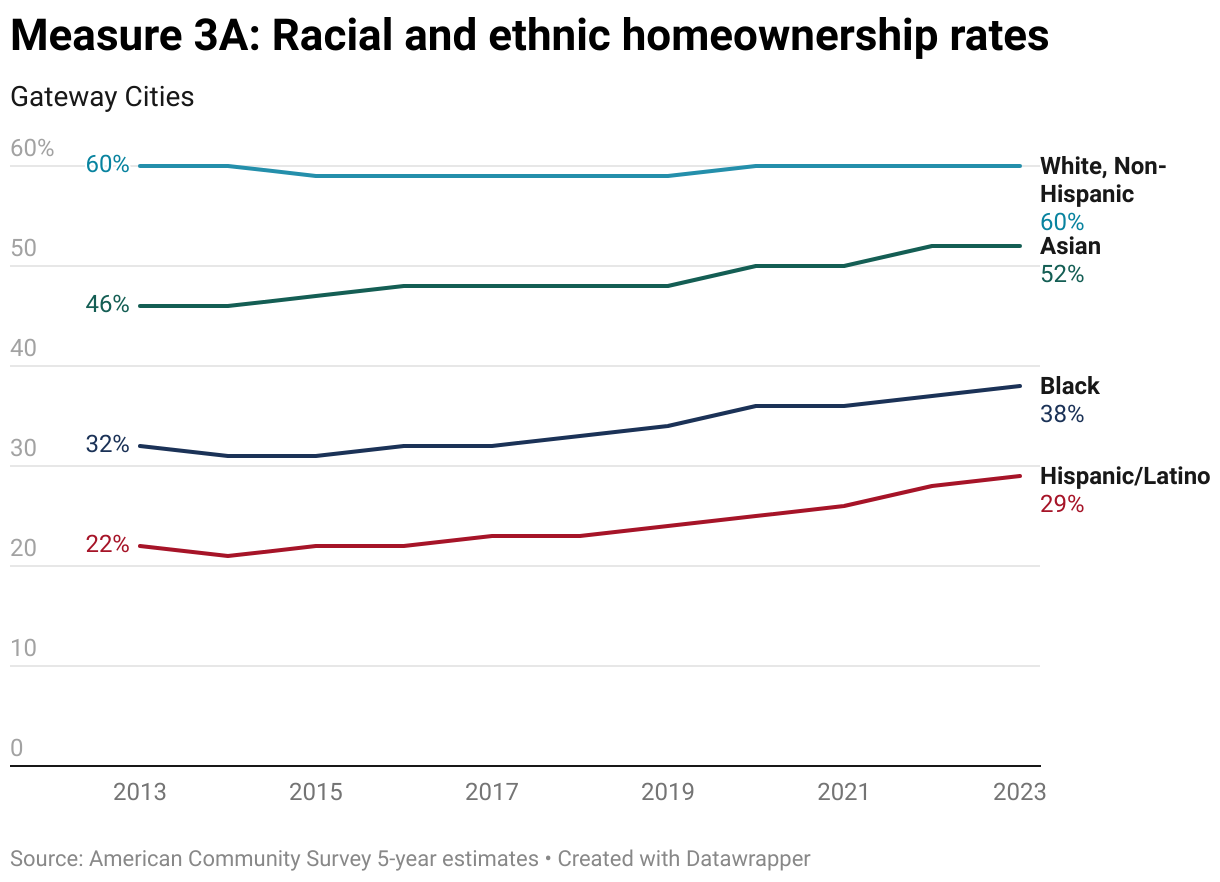
While still extremely large, racial and ethnic homeownership gaps have been steadily narrowing in Gateway Cities. Homeownership rates for people of color are rising in Gateway Cities. The Black-White homeownership gap in Gateway Cities stood at 23 percentage points in 2023, down 5 percentage points from 2013. The Hispanic-White gap narrowed by 6 percentage points, moving from 37 percentage points in 2013 to 31 in 2023.
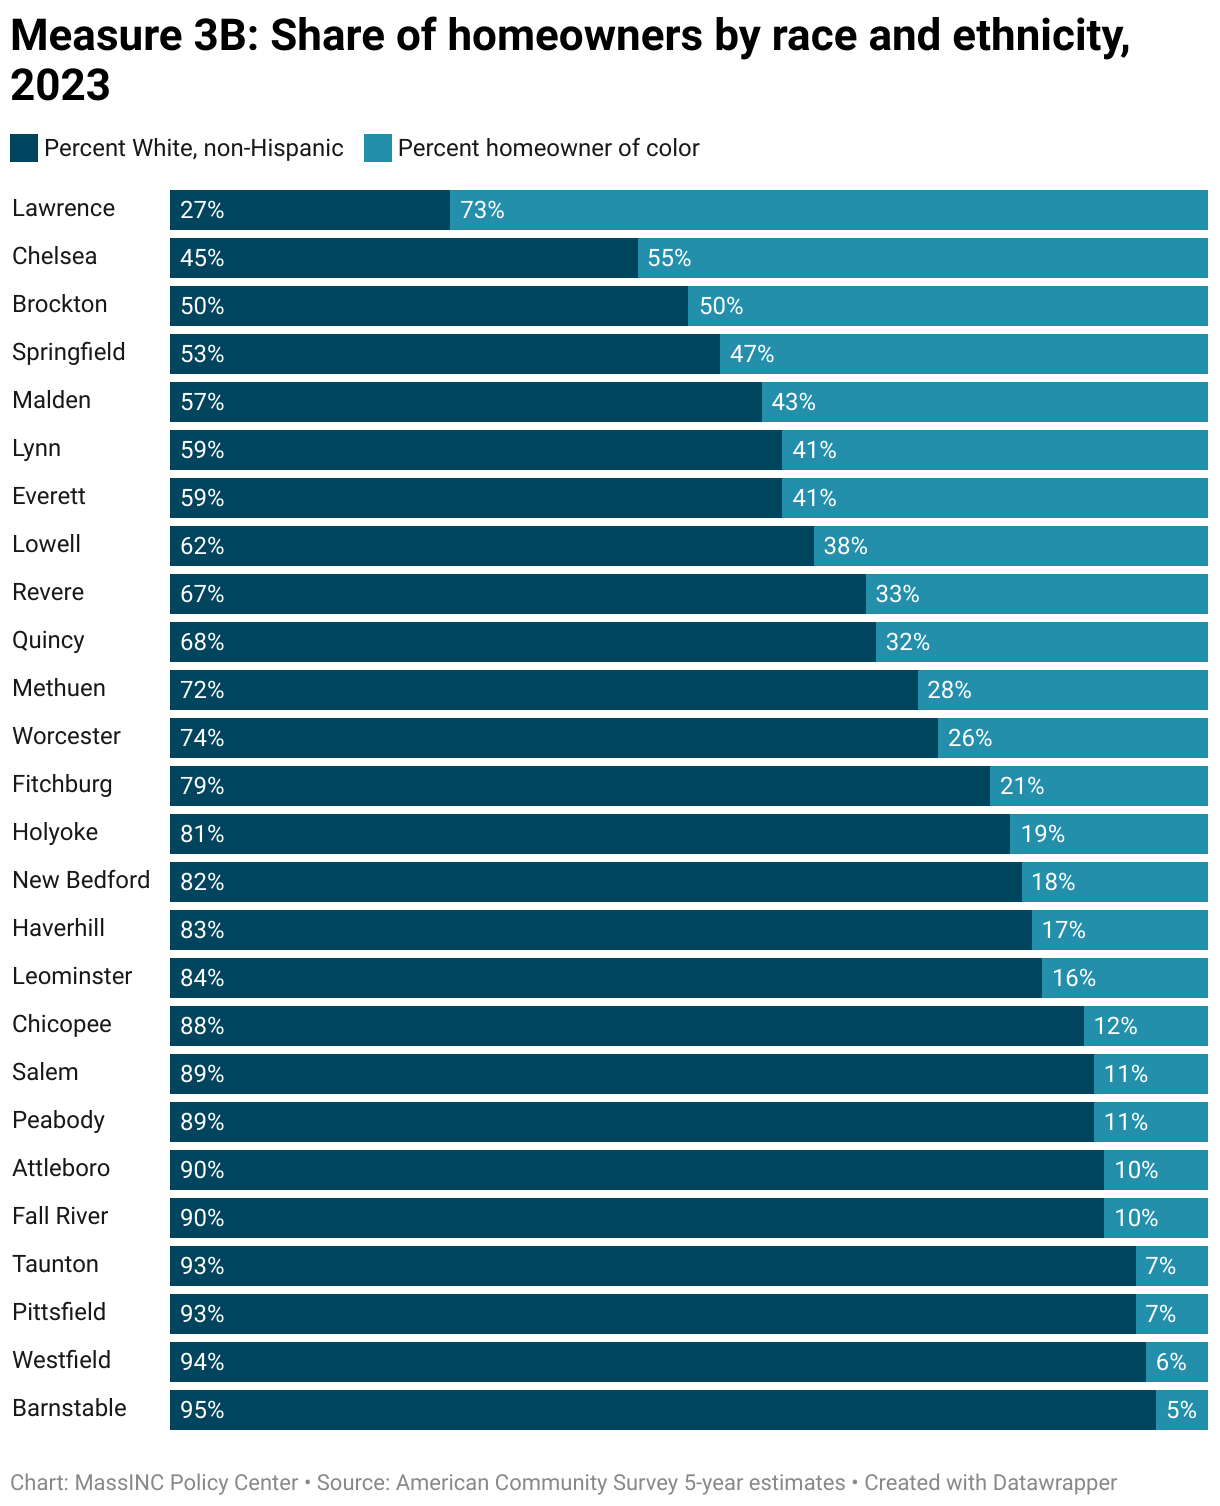
The Gateway Cities where residents of color make up the majority of homeowners also have the lowest homeownership rates. Chelsea and Lawrence, which have the largest shares of homeowners of color (55 and 73 percent, respectively), also have the lowest homeownership rates among the Gateway Cities (29 and 30 percent, respectively). So even in cities with large communities of color, people of color own a limited share of the residential real estate.
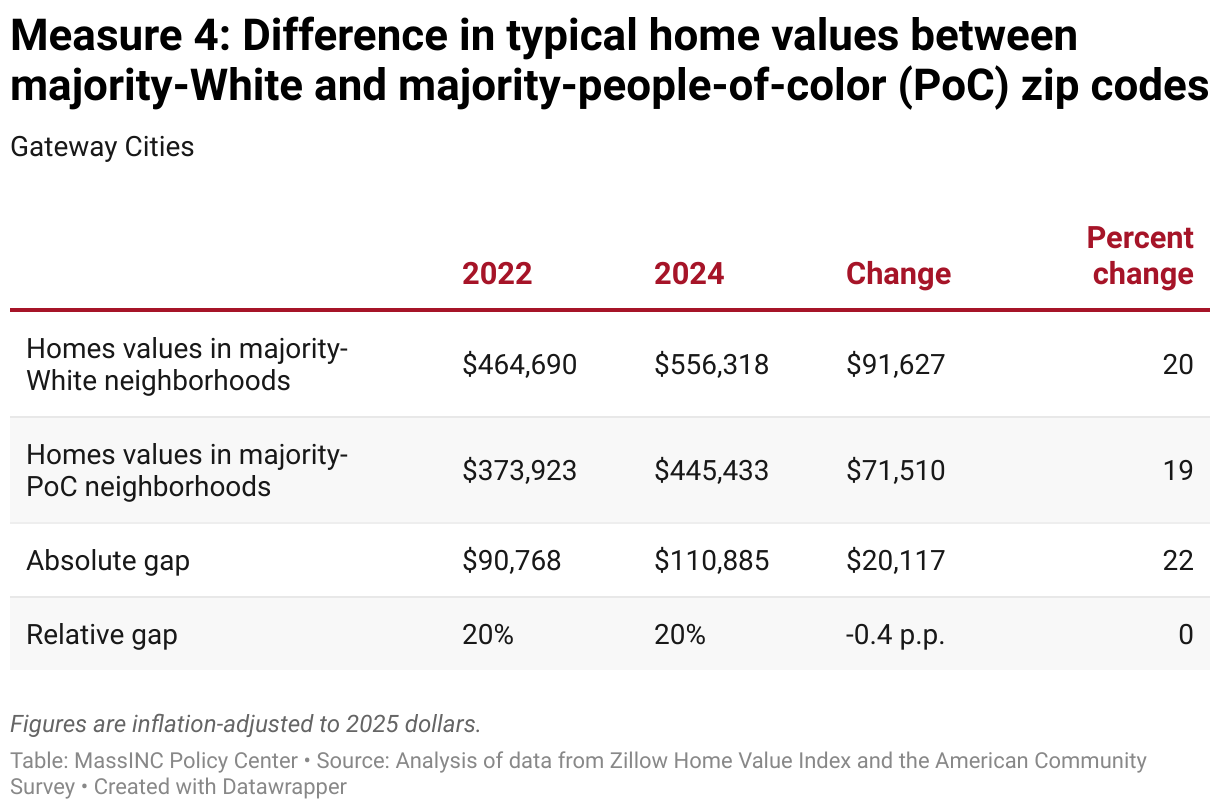
Within Gateway Cities, home values in neighborhoods of color are rising at the same pace as majority-White neighborhoods, but lower starting values meant equal rates of appreciation produced less wealth for residents of color. From 2022 to 2024, home values increased by around 20 percent after adjusting for inflation in both majority-White and majority non-White neighborhoods. However, average home in majority-White neighborhoods was worth $111,000 more in 2024, up from $91,000 more in 2022.
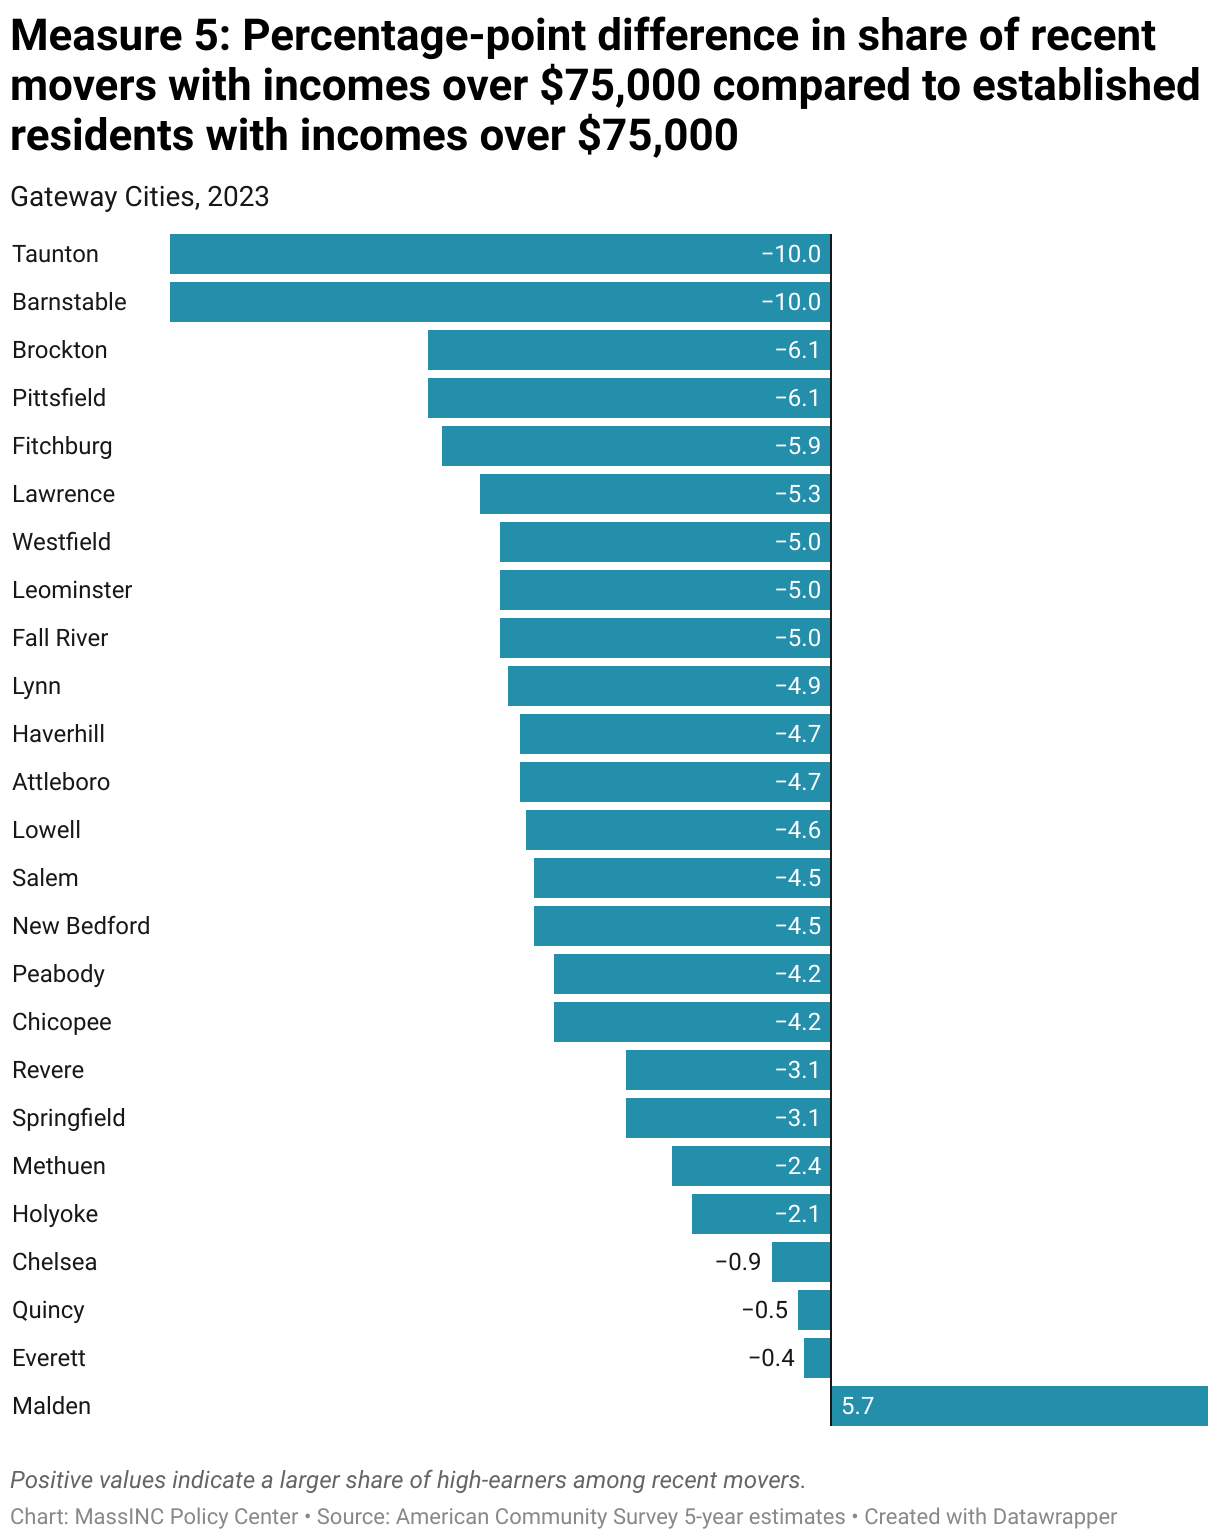
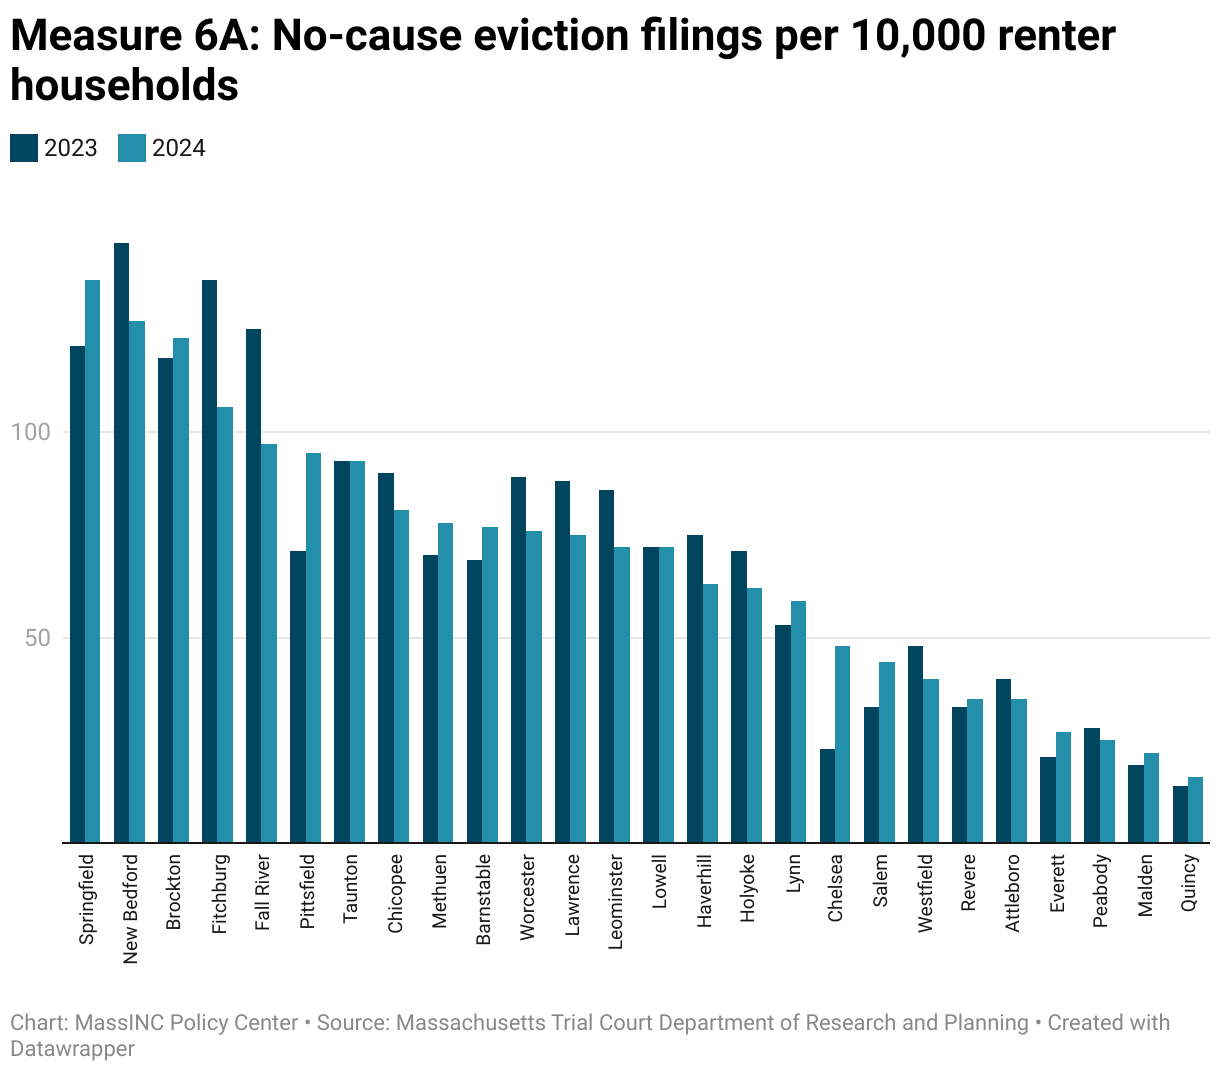
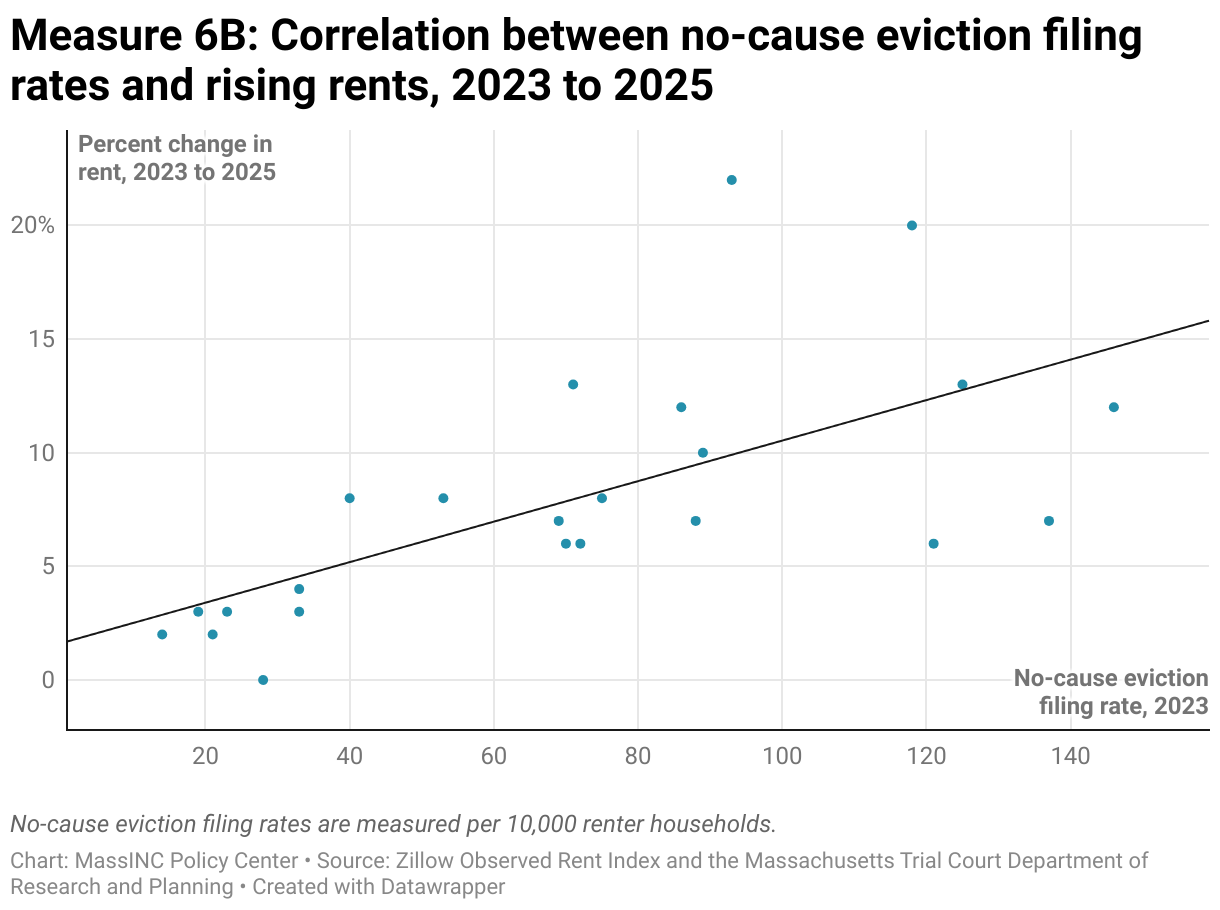
Newcomers are not wealthier than incumbent residents in most Gateway Cities, but landlords are still displacing current residents to get higher rents. Migration data show that in every Gateway City except Malden, residents arriving from other communities are much less likely than longer-term residents to have annual incomes over $75,000. But other pressures are pushing housing costs up, leading to displacement. No-cause eviction data show that filing rates are highest in communities where rents have been increasing at the fastest pace. Brockton and Taunton stand out with more than 90 no-cause eviction filings per 10,000 residents, alongside rent increases of over 20 percent. Fall River and New Bedford also have elevated rates and rapidly rising rents.
The sections that follow unpack this chapter’s key findings with greater detail on what each measure captures, why it matters, and how Gateway Cities are performing. Each topic can be expanded by clicking on the dropdowns, where you’ll also find notes about the data sources and methods used. Interactive charts allow you to hover over points for additional detail and share snapshots directly to social media. For those who want to dig deeper, the underlying datasets are available to download and explore. Together, these tools provide both a quick overview and a deeper dive into equitable development in Gateway Cities.
1. Homeownership
What does this measure?
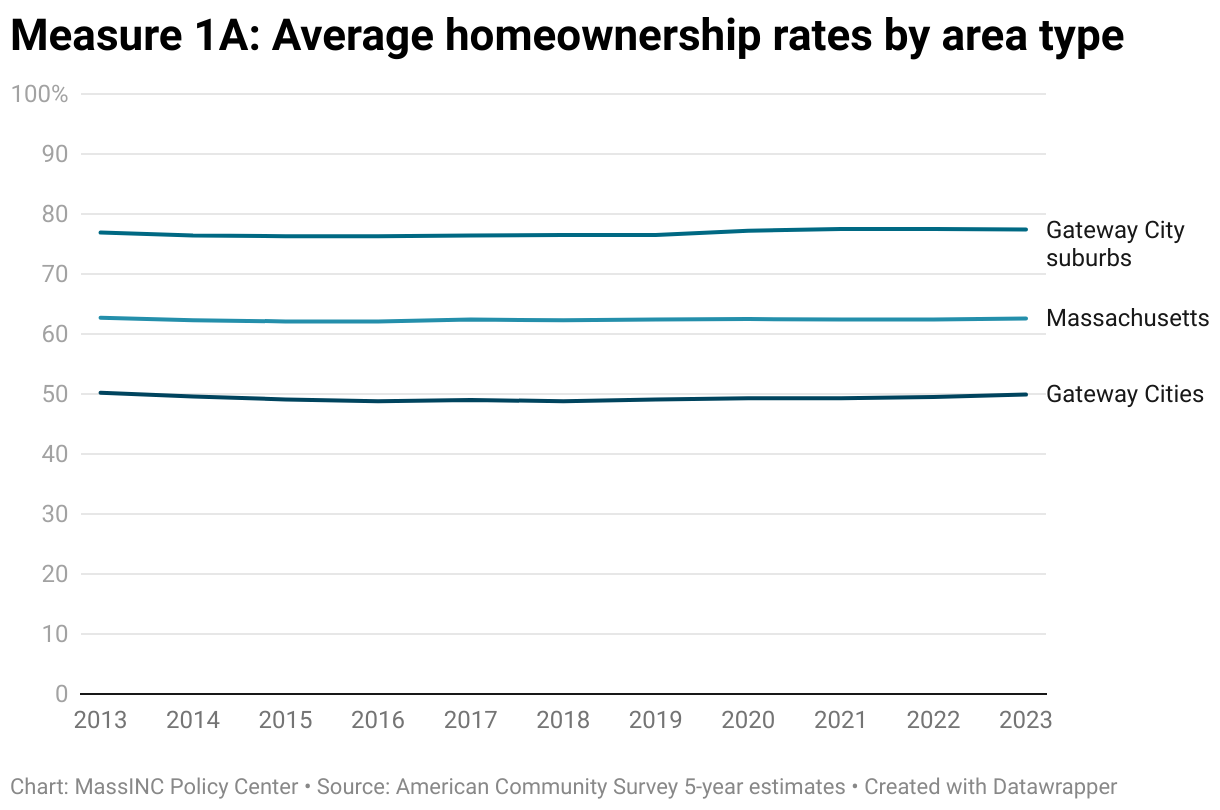
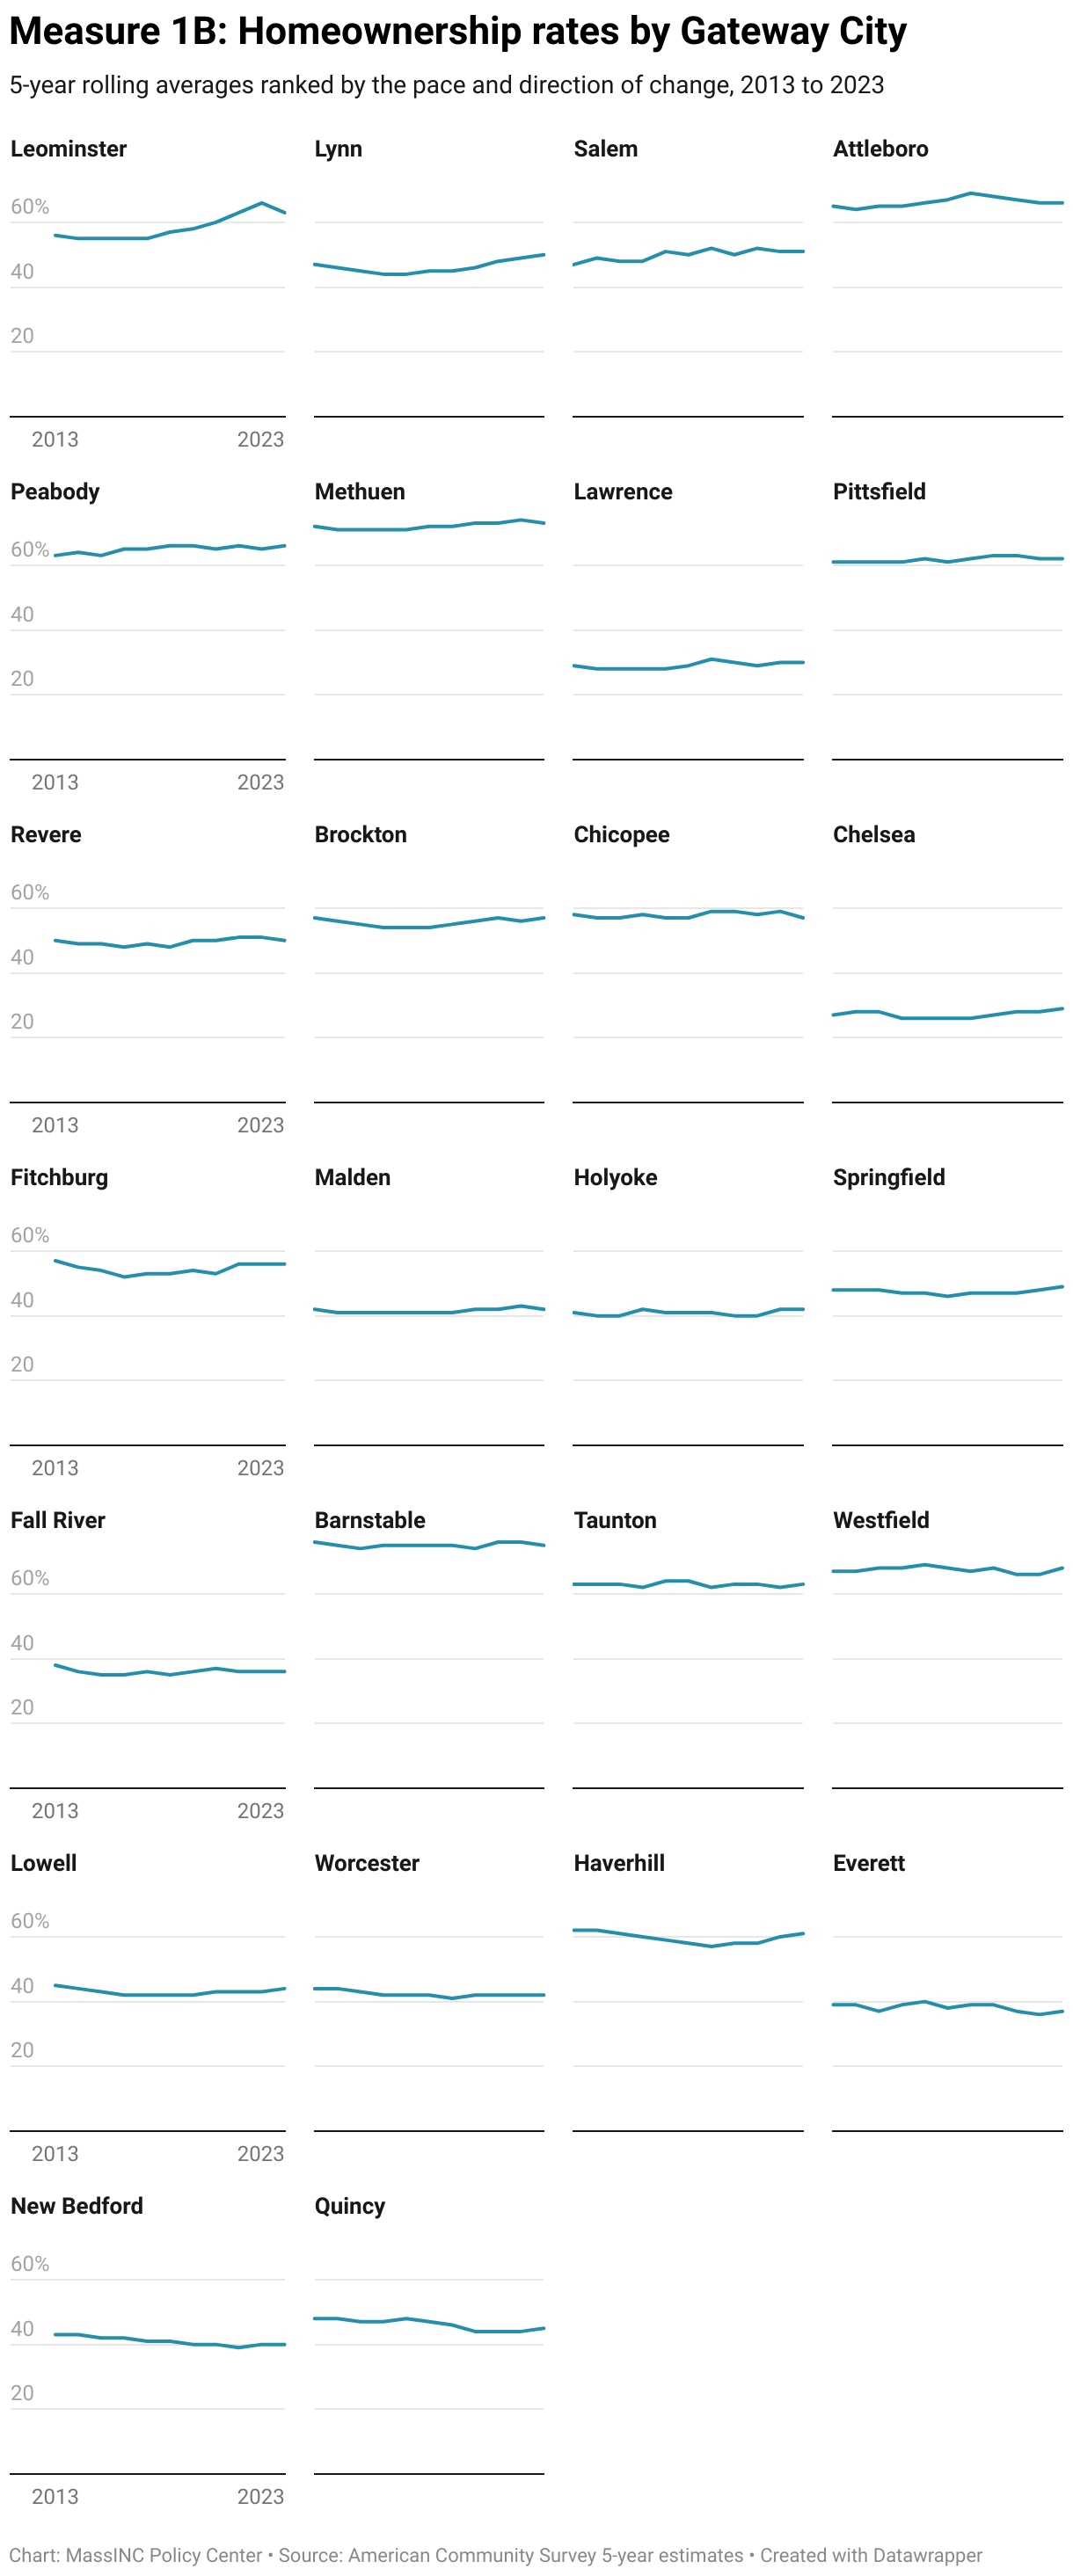
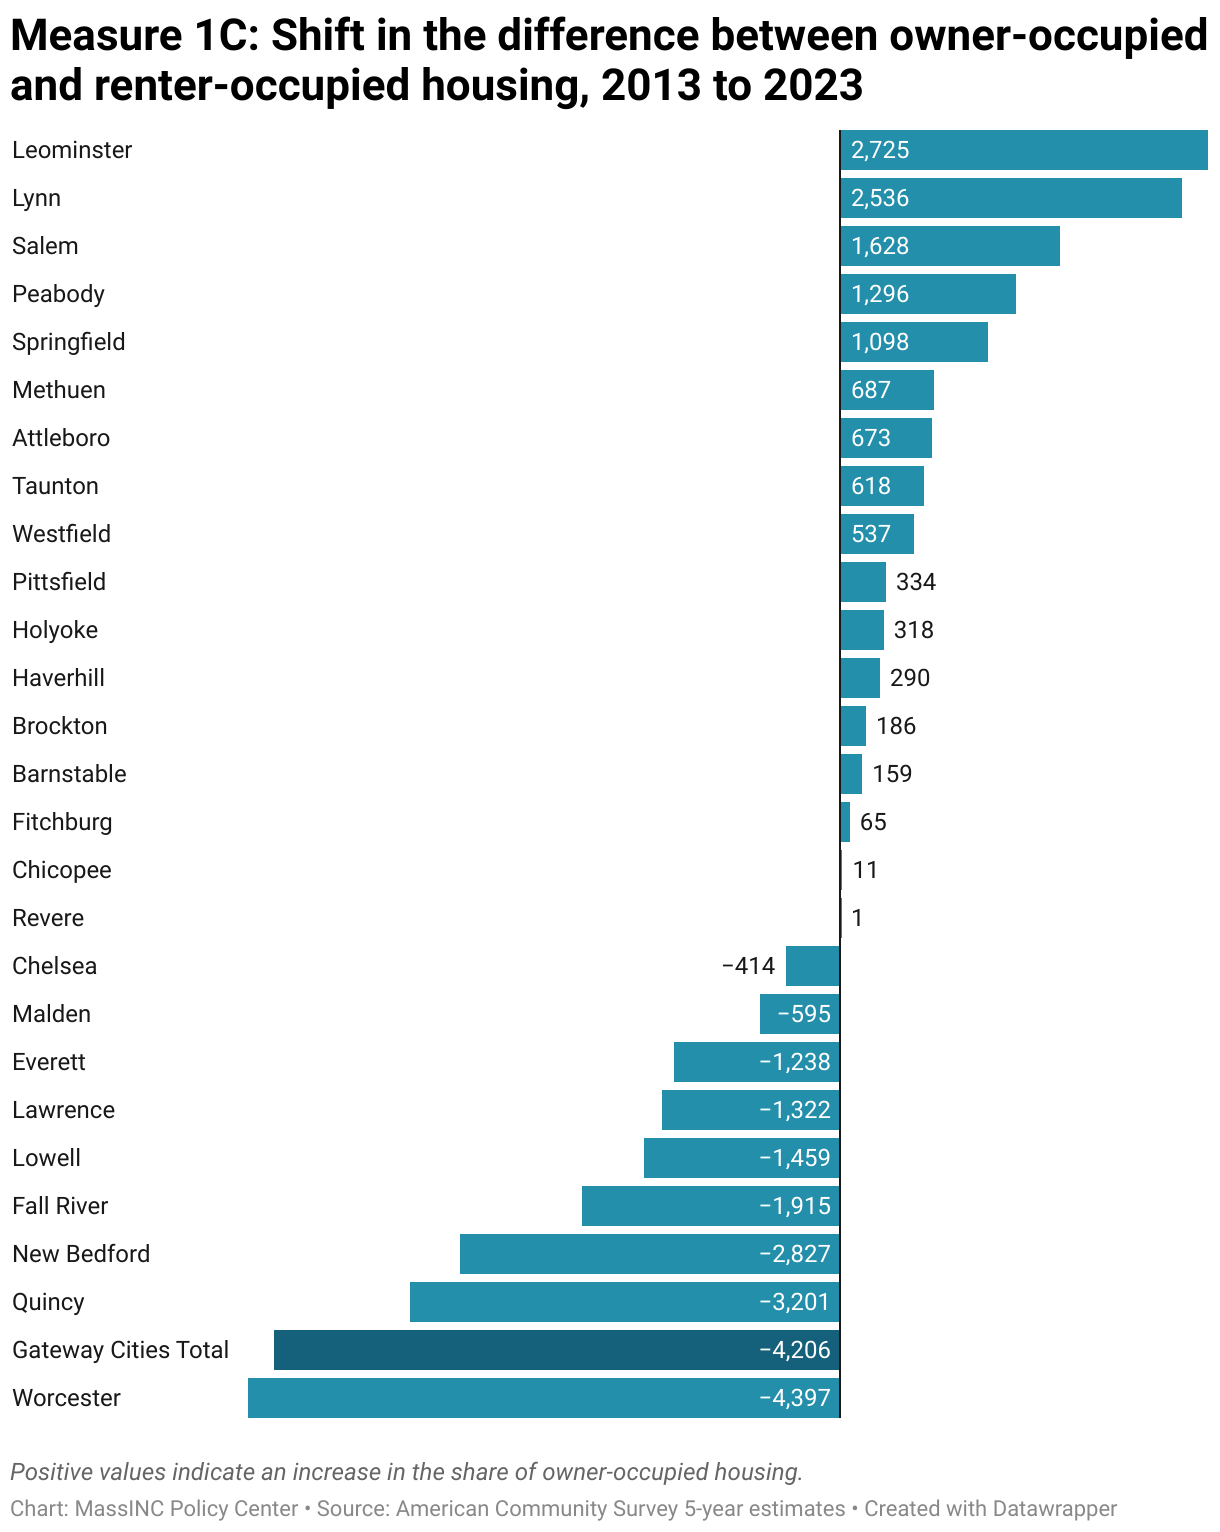
These measures track the percent of households that own their own home (regardless of mortgage status) for the Gateway Cities as a group, Gateway City suburbs, and the Massachusetts average. Measure 1B provides homeownership rates over the past 10 years for each Gateway City. And Measure 1C shows how the balance of total housing units has shifted between rental and homeownership during this period.
Why is this important?
Homeownership patterns can tell us a lot about whether growth is generating equitable outcomes in low- to moderate-income communities. Residents who own their own homes build wealth when neighborhoods that have suffered from decades of disinvestment revitalize. Homeowners are also protected from displacement pressures, which may increase when reinvestment makes urban neighborhoods more vibrant and desirable places to live.
However, this accounting does not distinguish between potential causes because the same dwelling can cycle between owner-occupied and renter-occupied over time. A shift toward renters might reflect new apartment completions, owner units converting to rental, or previously vacant units being rented; a shift toward owners might reflect for-sale construction, rental-to-owner conversions (e.g., condo/owner move-ins), or reactivation into ownership.
Notes about the data
These estimates come from the US Census Bureau’s American Community Survey (ACS). ACS produces both 1-year and 5-year estimates, but 1-year data are only available for geographies with populations above 65,000. Since many Gateway Cities fall below this threshold, 5-year estimates must be used for this analysis. Five-year estimates average data collected over multiple years. This smooths out short-term changes and makes these estimates better suited for tracking longer-term patterns.
How are Gateway Cities doing?
Over the past 10 years, the homeownership rate for Massachusetts residents who live in Gateway Cities has hovered around 50 percent. Likewise, the homeownership rate for Gateway City suburbs has been very stable at just under 80 percent of households, and the statewide rate has also been flat at around two-thirds of households (63 percent).
Across the Gateway Cities, homeownership rates vary greatly. Under 40 percent of households own in New Bedford, Everett, Fall River, Lawrence, and Chelsea, whereas homeownership rates are above the state average in Barnstable, Methuen, Westfield, Attleboro, Taunton, and Leominster.
Between 2013 and 2023, homeownership rates remained stable for most Gateway Cities, except New Bedford and Quincy, where they fell 3 percentage points, and Lynn, Salem, and Leominster, where homeownership increased 4, 4, and 7 percentage points, respectively. In all the cities where homeownership rates declined, the absolute number of homeowners also fell. This means the falling homeownership rate was at least partially driven by housing units that were previously occupied by owners becoming rentals, as opposed to solely the result of new apartment buildings added to the city’s housing stock over the past 10 years.
From 2013 to 2023, growth in renter-occupied housing in Gateway Cities outpaced growth in owner-occupied housing by 4,200 units. This shift pushed the overall balance from a slight majority for owner-occupancy to a slight majority for renter-occupancy. Trends varied widely across cities; places like Leominster, Lynn, and Salem saw increases in owner-occupied homes, but these gains were outweighed by larger shifts toward renting in places like Worcester, Quincy, New Bedford, and Fall River.
2. Owner-Occupancy of Income-Producing Properties
What does this measure?
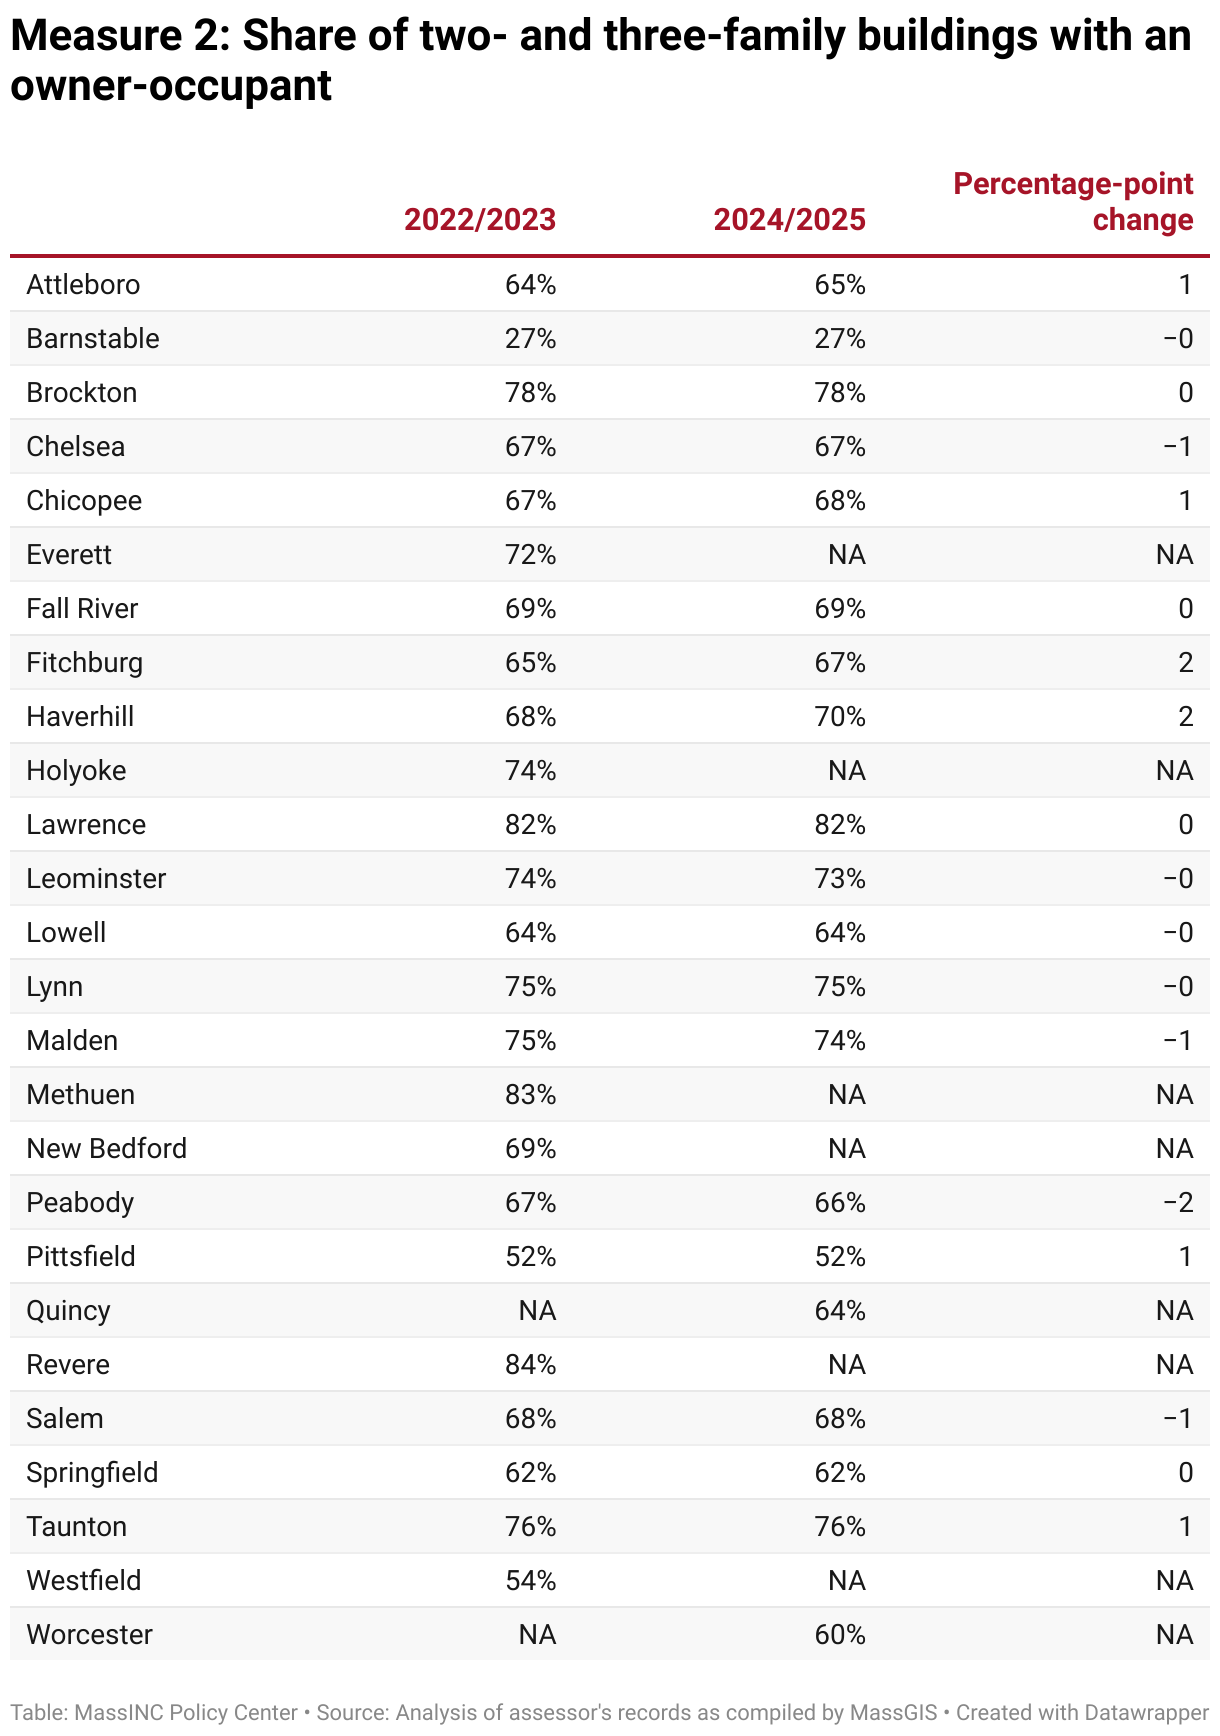
These data track the share of two- and three-family homes that are owner-occupied, meaning that the owner lives in one of the two or three units.
Why is this important?
Owner-occupancy—especially of duplexes and three-family homes—creates a wealth-building path by pairing a home with rental income, anchoring stability and equity gains in the community. When ownership tilts toward absentee investors, maintenance and responsiveness can slip, tenant turnover can rise, and investor capital can outbid local buyers, shifting control and financial returns away from residents. Tracking owner-occupancy by building type shows whether revitalization is benefitting incumbent residents, and it helps inform interventions to keep small multifamily homeownership within reach of residents.
Notes about the data
Because this measure draws from assessor’s files, it is possible to examine more recent change. However, assessor’s offices do not update publicly available files every year. For this reason, we created multi-year samples for two recent periods (2022–2023 and 2024–2025). Drawing from this dataset, we classified buildings as owner-occupied when two conditions held: (1) the owner of record appeared to be an individual (not a company or institution), and (2) the owner’s mailing address matched the property’s site address after fuzzy matching to accommodate formatting differences and typographical mistakes. Non-individual owners were flagged with a keyword dictionary in the owner-name field (e.g., Inc, LLC, LLP, bank, investment, company, etc.). Trusts for which the owner’s address matches the parcel address are assumed to be owner-occupied, unless the trust is identified to be a real estate investment trust or realty trust.
How are Gateway Cities doing?
Owner-occupancy in duplexes and three-families is stable at 67 percent of these structures from the 2022–2023 sample to the 2024–2025 sample. Most Gateway Cities had owner-occupancy rates close to the average with a few exceptions. Most notably, Barnstable and Pittsfield are well below the average and Lawrence and Brockton are well above it, each with a difference from the average in excess of 10 percentage points.
While two- and three-family owner-occupancy levels were stable in most cities over the past few years, there were some notable exceptions in both directions. In Haverhill and Fitchburg, owner-occupancy increased by 1.9 and 1.6 percentage points, respectively; Fitchburg is now at the Gateway City average and Haverhill slightly exceeds it. Meanwhile, owner-occupancy dropped by the largest percentage in Malden and Peabody, falling by 1.5 and 1.0 percentage points, respectively. While Malden remains above the Gateway City average, Peabody now sits slightly below it.
3. Homeownership by Race and Ethnicity
What does this measure?
These indicators track changes in homeownership within communities by race and ethnicity. The Measure 3A indicator reports the percentage-point gap in homeownership rates between White householders and Black, Hispanic, and Asian householders. Negative values mean White householders own at higher rates; zero indicates parity. Measure 3B shows the composition of homeowners in each city by race and ethnicity as of 2023.
Why is this important?
Homeownership and renting are not just housing choices; they’re different positions in a local housing market. In places where prices are appreciating, the gains tend to accrue to owners, while renters absorb higher housing costs and face greater displacement risk. Since households of color in Gateway Cities are more likely to rent, a persistent tenure divide can reinforce class differences by race and ethnicity, even as neighborhoods revitalize. Tracking the homeownership rate gap over time provides a clear test of whether revitalization is narrowing disparities in access to homeownership.
Notes about the data
These estimates come from the US Census Bureau’s American Community Survey (ACS). ACS produces both 1-year and 5-year estimates, but 1-year data are only available for geographies with populations above 65,000. Since many Gateway Cities fall below this threshold, 5-year estimates must be used for this analysis. Five-year estimates average data collected over multiple years. This smooths out short-term changes and makes these estimates better suited for tracking longer-term patterns. The estimates for White residents include all those classified in the data as White, non-Hispanic.
How are Gateway Cities doing?
Homeownership rate disparities between White households and households of color have improved over the past 10 years in Gateway Cities, decreasing between 5 and 6 percentage points from 2013 to 2023. However, the gap is still extremely large, particularly for Black and Hispanic households, which have homeownership rates 23 percentage points and 32 percentage points lower than for White Gateway City households, respectively.
Still, Gateway Cities outperform the remainder of the state. The homeownership rate gap for Black households is 14 percentage points smaller in Gateway Cities than the remainder of the state and 6 percentage points smaller for Hispanic households. Black households in particular are increasingly finding ownership opportunities in Gateway Cities; the homeownership rate gap is improving faster in Gateway Cities, narrowing 5 percentage points compared to 3 percentage points elsewhere in Massachusetts.
In most Gateway Cities, White residents continue to make up a large majority of homeowners; however, several Gateway Cities have substantial diversity in ownership. In Lawrence and Chelsea, households of color make up the majority of homeowners, while in Brockton homeowners are about evenly split between White residents and residents of color. Springfield, Malden, Lynn, and Everett also have diverse mixes.
However, it is important to note that the cities where residents of color make up a large share of homeowners generally have very low homeownership rates overall. Lawrence and Chelsea, which have the largest shares of homeowners of color, also have the lowest homeownership rates among Gateway Cities, and the number of homeowners in these communities has been declining. Unless something changes structurally to afford more residents with opportunities to purchase homes in these cities, the majority of residents will not build wealth as their communities revitalize.
4. Home Price Appreciation in Neighborhoods of Color
What does this measure?
This measure tracks home value appreciation over the past two years in neighborhoods where people of color make up a majority of residents and compares it to neighborhoods with a majority-White population.
Why is this important?
A majority of people of color who purchase homes in Massachusetts buy in one of the state’s Gateway Cities. In this regard, the state’s progress in closing racial wealth gaps is heavily contingent on the trajectory of Gateway City neighborhoods, particularly the areas within Gateway Cities where people of color have purchased.
Notes about the data
Home values are at the zip-code level as provided by the Zillow Home Value Index. The racial and ethnic populations for each zip code were identified using data from the American Community Survey. Methodological notes about the Zillow Home Value Index can be found here: Zillow Home Value Index Methodology, 2023 Revision: What’s Changed? – Zillow Research.
How are Gateway Cities doing?
Between 2022 and 2024, typical inflation-adjusted home values in majority-White Gateway City neighborhoods rose from about $465,000 to $556,000, a 20-percent increase. At the same time, home prices increased from $374,000 to $445,000 in Gateway City neighborhoods where people of color make up a majority of residents. While this 19-percent increase was on par with majority-White neighborhoods, home values in communities of color remain about 20 percent lower. Roughly equal percentage gains on unequal baselines mean those living in majority-White neighborhoods saw a larger net increase in equity, furthering the racial wealth gap.
5. Gentrification Pressure
What does this measure?
This measure compares the share of households who moved into each city in recent years with income above $75,000 to the share of incumbent households with income over this threshold. In the chart, positive values mean recent newcomers are more likely to be higher-income than more established residents.
Why is this important?
In-migration of higher-income residents could create gentrification pressures, especially when housing supply is constrained. This is a real concern: When higher-income newcomers arrive and costs rise, longtime residents can be priced out and community networks can fray. Mitigating this risk requires a strong grasp of why housing costs are rising. With this information, communities can craft strategies that allow for much-needed investment and ensure that long-term residents benefit from neighborhood development.
Notes about the data
These estimates come from the US Census Bureau’s American Community Survey (ACS). ACS produces both 1-year and 5-year estimates, but 1-year data are only available for geographies with populations above 65,000. Since many Gateway Cities fall below this threshold, 5-year estimates must be used for this analysis. Five-year estimates average data collected over multiple years. This smooths out short-term changes and makes these estimates better suited for tracking longer-term patterns.
How are Gateway Cities doing?
In general, Gateway City newcomers have slightly lower incomes than people who have lived in these communities for longer. Only in Malden is the share of residents with incomes above $75,000 higher among newcomers than among longer-term residents. This is particularly concerning given that Malden ranks near the bottom of Gateway Cities in terms of recent housing production—the best protection against displacement is producing more housing to accommodate both new and established residents.
Chelsea, Quincy, and Everett are essentially at parity—the newcomer high-income share is not distinguishable from the established share. In the remaining 22 Gateway Cities, newcomers are more likely to have lower incomes than established residents. This suggests that rising housing costs in these communities are not due to an influx of higher-income residents.
6. Displacement
What does this measure?
This indicator tracks the number of no-cause eviction filings per 10,000 residents in Gateway Cities. A no-cause eviction occurs when a landlord seeks to remove a tenant without alleging nonpayment of rent, violation of lease terms, or other “just cause.” In Massachusetts, this is typically done through a notice to quit followed by a court filing, and it can happen even when tenants are current on rent and following their lease. Because the filing does not require a specific reason, it highlights the degree of housing insecurity tenants face purely at a landlord’s discretion.
It is important to distinguish filings from executions. A filing represents the landlord initiating a case in housing court. Many filings do not end in actual displacement—cases may be dismissed, settled, or withdrawn, and tenants sometimes move voluntarily under pressure. An execution is the court order authorizing the sheriff or constable to physically remove the tenant. For this reason, filings are best understood as a measure of legal actions that create instability and stress in communities, while executions capture the subset that results in forced displacement.
Why is this important?
Research shows eviction filings and removals are much higher in low-income neighborhoods that are not undergoing gentrification than in places where gentrification is underway. But this pattern could be very different for no-cause evictions. Many are concerned that landlords are using this process to remove tenants at will—often those with month-to-month leases—so they can vacate apartments and seek higher rents, with or without renovating the unit.
Unlike non-payment filings, which primarily reflect tenants’ economic hardship, no-cause filings may signal shifts in landlord strategy or speculative market activity. Even when they do not lead to court-ordered removals, these filings destabilize households, since many families move preemptively to avoid a formal eviction record. In Massachusetts, where statewide “just cause” protections are absent, tracking no-cause filings is especially important for understanding how landlord practices and market pressures shape displacement risk in Gateway Cities.
Notes about the data
These estimates come from the US Census Bureau’s American Community Survey (ACS). ACS produces both 1-year and 5-year estimates, but 1-year data are only available for geographies with populations above 65,000. Since many Gateway Cities and all sub-city geographies fall below this threshold, 5-year estimates must be used. Five-year estimates average data across multiple years of surveys, which smooths out short-term changes and makes them best suited for tracking longer-term patterns.
How are Gateway Cities doing?
Across Gateway Cities, there is a clear relationship between rising rents and the prevalence of no-cause eviction filings. In communities where rents have surged the fastest, filings are consistently among the highest. Taunton and Brockton, which saw rents jump more than 20 percent over two years, both reported over 90 no-cause filings per 10,000 residents in 2024. Similarly, Fall River and New Bedford had double-digit rent growth and very high filing volumes. By contrast, Gateway Cities near Boston with already high rent levels—such as Quincy, Malden, Chelsea, and Everett—have had much lower filing rates alongside slower rent growth. Together, these patterns suggest that landlords in the state’s lowest-cost Gateway Cities believe that they can get higher rents given how tight housing markets are throughout the state.
2025 Gateway Cities Housing Monitor
Chapters

2025 Gateway Cities Housing Monitor
September 17, 2025