
“How many households in Massachusetts can actually afford a middle-class standard of living?”
When middle-class status is defined not by income percentiles but by the ability to live the American Dream, the answer is fewer households are making it in Massachusetts than some might assume. However, the Bay State is by no means an outlier in this regard. While Massachusetts is among the most expensive places to live in the US, its relatively high incomes mean that the state performs at or above the national average in terms of the share of residents that can afford a middle-class lifestyle for most household types.
Introduction
Component 1 quantified the income required to achieve the American Dream in Massachusetts and across the 50 states. Now we examine how many households in Massachusetts have sufficient income to meet this standard and the jobs that offer this level of pay.
We begin by comparing the actual incomes of benchmark households (see the Appendix for a full description of methods) to their minimum middle-class budget thresholds, examining variability by race and ethnicity, over time, and across states. We then look at the labor market to understand how common it is for workers to be employed in jobs that provide sufficient wages to support this standard of living. The analysis concludes by examining the extent to which jobs that are socially considered to be middle-class actually allow for a middle-class lifestyle in Massachusetts.
1. The Share of Massachusetts Households Achieving Middle Class Income Levels
The share of Massachusetts households with income above the minimum middle-class budget threshold varies considerably by household type, life stage, and race and ethnicity. The proportion meeting this standard ranges from just a few percent for some family types to more than two-thirds for others, depending on household structure and phase of life. In general, households without children are more likely to be able to afford a middle-class lifestyle than households with children, and households with two adults are more likely to do so than those with just one. Across all household types, White and Asian households are more likely to meet the threshold than Black and Hispanic households.

For households without children, the share of households with incomes that support a middle-class lifestyle ranges from 24 percent for a single adult living alone during their retirement years to 67 percent for two young adults sharing expenses. Notably, the share of childless households who meet the threshold declines with age. There are several plausible explanations for this pattern:
- Life-cycle transitions. By the mid-30s and 40s, the group of adults who remain without children may be disproportionately composed of individuals with fewer economic resources. This compositional shift could contribute to the observed decline, though the analysis does not follow individuals over time to directly test this mechanism.
- Selective migration. If younger childless residents disproportionately leave Massachusetts when they cannot afford local costs, while older residents remain in the state due to social ties or moving costs, this could also contribute to the pattern. However, this analysis does not directly model migration behavior.
- Delayed household formation and co-residence. A growing share of young adults live with parents or other family members, often for economic reasons. These individuals are not classified as independent households in this analysis. When they later form independent households, they may do so at lower income levels, which could reduce the share of older childless households meeting the threshold.
- Temporary policy effects. As noted in the prior section, the 2024 middle-class budget does not include student loan payments due to administrative forbearance under the SAVE plan. Because student debt is concentrated among younger adults, this unusual event temporarily lowered the income required to meet the middle-class threshold for those households in 2024. As payments resume, the share of younger households meeting the threshold will fall in the future, all else equal.
Taken together, the decline in middle-class attainment with age among childless households should not be interpreted as a purely age-driven economic effect. Instead, it likely reflects a combination of temporary policy conditions and underlying compositional effects related to family formation, migration, and living arrangements.
For households with children, there is substantially greater variability, driven in part by larger swings in the minimum middle-class budget over the life course. Compositional effects—such as outmigration—may also play a role. In contrast to childless households, the share of families with children able to attain a middle-class standard of living is lowest among those ages 26 to 34, when relatively low earnings and high childcare costs coincide. During this stage, only about 1 percent to 27 percent of households meet the threshold, depending on the number of adults—and especially earners—in the household.
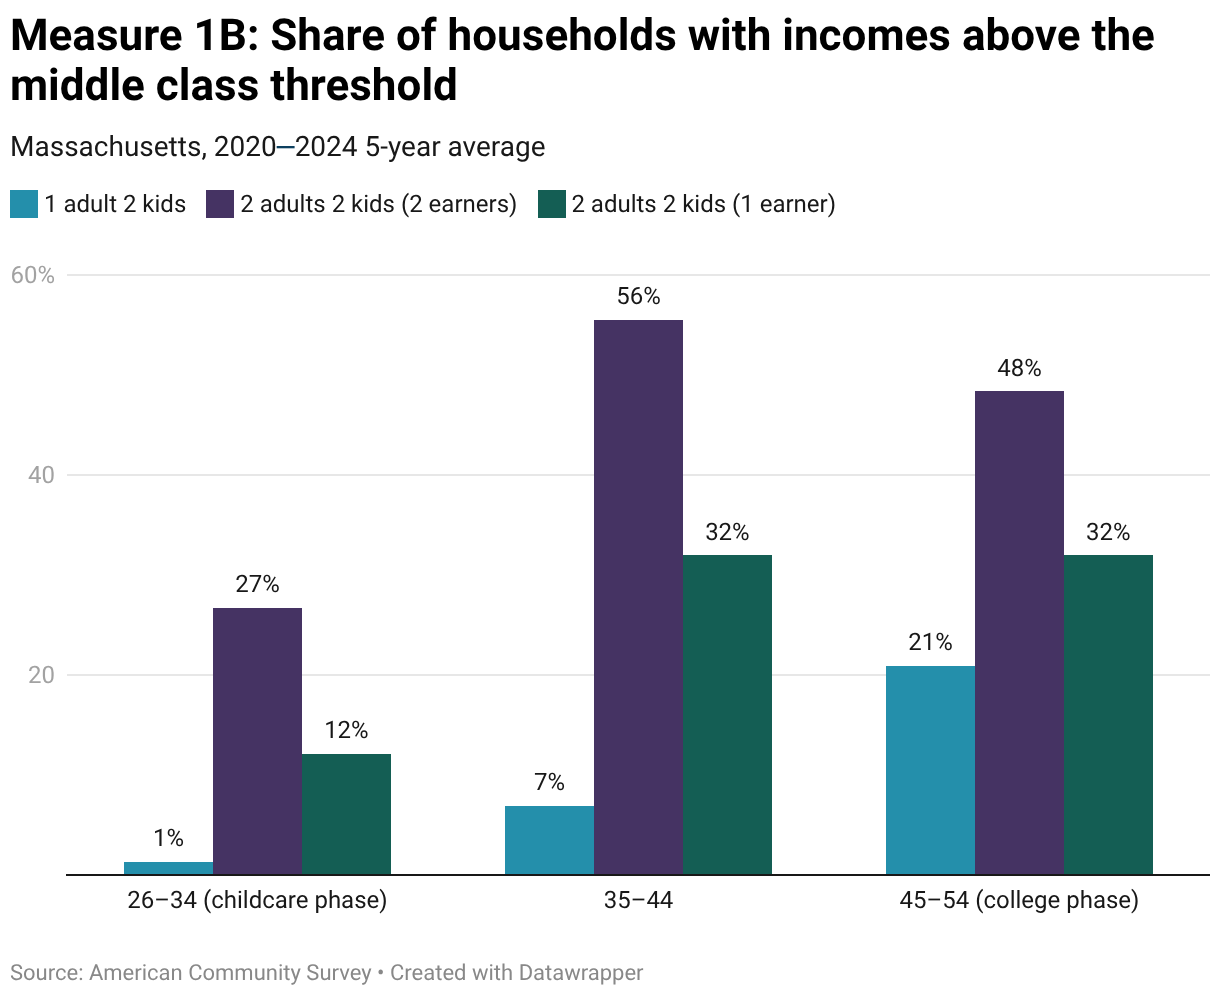
During the time when children are eligible for a public education, the share of households attaining a middle-class standard of living rises substantially—reaching 56 percent among those ages 35 to 44. It remains relatively high at 48 percent among those ages 45 to 54, when many households begin to take on college-related expenses but also benefit from higher earnings. Across these child-rearing years, two-adult households with a single earner consistently fall between single-adult households and two-earner households, likely reflecting household decisions about whether one income is sufficient to meet financial needs.
Differences by race and ethnicity are evident across all household types and follow a consistent pattern. In every category, Black and Hispanic households are substantially less likely than White households to attain a middle-class standard of living, with Asian households often showing similar or higher rates than White households. This pattern holds regardless of whether households are single adults, couples, or families with children, indicating that these disparities are not driven solely by differences in household structure.
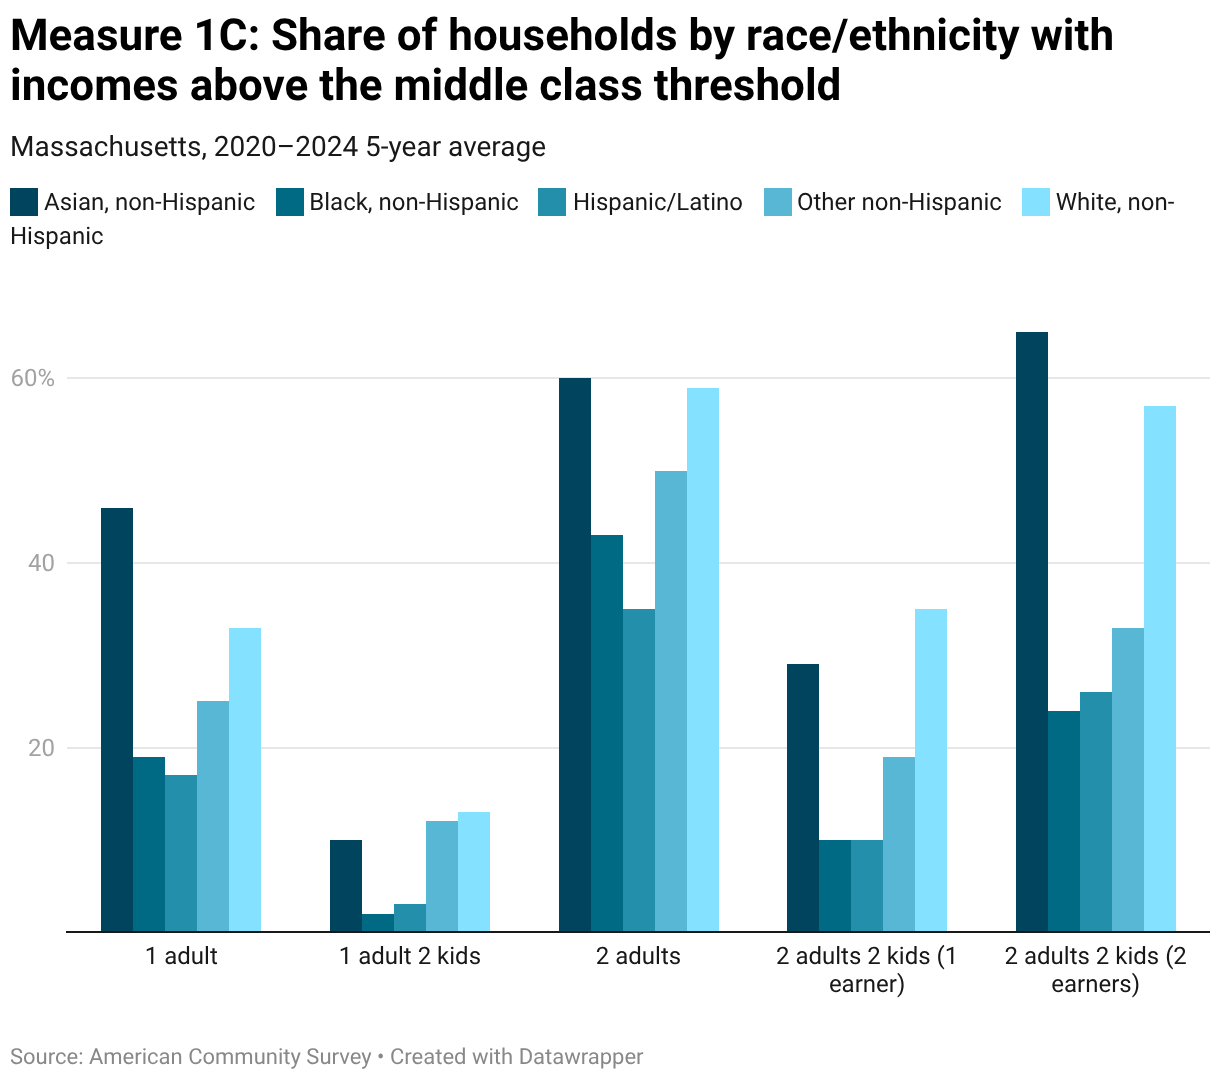
While middle-class attainment is lowest overall among single-adult households with children, the largest racial and ethnic gaps appear among two-adult households with children—particularly those with two earners. In this group, the share of households meeting the threshold is more than 30 percentage points higher for White households than for Black and Hispanic households. This suggests that differences in individual earnings may translate into larger household-level gaps when income is derived from more than one worker, although this analysis does not directly decompose earnings within households.
2. Trends Over Time
Over the past two decades, the share of households without children that meet the minimum middle-class threshold has been extremely stable at about one-third for single adults and one-half for two adults.
For a single adult with children, the share with income above the minimum threshold fell 5 percentage points from the pre-pandemic peak (14 percent) to the post-pandemic trough (9 percent). Two-adult households with children and one earner experienced a slightly larger decline over this period, dropping 8 percentage points (from 36 percent to 28 percent). Dual earners with children have had more stability, falling just 3 percentage points from pre-pandemic levels. Moreover, the share of dual earners with children meeting the middle-class budget threshold is still 5 percentage points higher than in the mid-2000s.
Horizontal Tabs


Across all household types, the share of Hispanic households achieving middle-class status increased in comparison to White households over the past two decades. The largest relative change came within the single adult with children group, where the White middle-class share declined by 6 percentage points and the Hispanic middle-class share rose by 1 percentage point. For Black households, change relative to Whites was mixed. Black households with a single adult and two children, two adults, and two adults with children and a single earner all increased their middle-class shares slightly relative to White households. However, the share of Black households with two adults and two children in the middle-class remained unchanged over the past two decades, while the White middle-class share rose 6 percentage points.
Horizontal Tabs


3. Massachusetts Relative to Other US States
To draw reliable comparisons across states, we average across age cohorts for each household type. This approach reveals wide variation between states, with rankings shifting considerably based on household structure. The Massachusetts middle-class falls anywhere from the top to the bottom of states depending on the household type.
For single adults without children, Massachusetts sits near the middle of the national distribution (26th among states). At 31 percent reaching the middle-class threshold, we are 12 percentage points below the top state (Alaska) and 8 percentage points below Maryland, a more comparable peer.
With only 9 percent above the minimum middle-class budget threshold, our relative position is much weaker for single parent households (43rd). We fall 13 percentage points below the leading state (North Dakota). However, the distribution on this measure is notably compressed; Massachusetts is only a percentage point or two below the middle of the pack.

Massachusetts ranks in the top tier (8th) for two-adult households with children. With 53 percent above the middle-class budget threshold, we are only 4 percentage points below Maryland and New Hampshire in the top grouping. Even among two-adult families with children supported by a single earner, Massachusetts remains in the top tier (10th), with 28 percent of these households earning enough income to support a middle-class lifestyle. For two-adult households without children, Massachusetts ranks 7th, with 56 percent above the middle-class threshold, trailing behind Maryland and New Hampshire once again by only a few percentage points.
Component 1 showed Massachusetts reliably sat with California and Hawaii among the highest-cost states, particularly for families with children. However, when we compare incomes, Massachusetts households with children are in a better position relative to these high-cost states and most others.
Horizontal Tabs


4. Middle Class Jobs in Massachusetts
Across the working-age cohorts, the middle-class budget requires an average annual income of roughly $90,000 for a single adult in Massachusetts. This number provides a floor to identify jobs in today’s Massachusetts economy that allow residents to maintain a middle-class lifestyle. Roughly 30 percent of jobs currently provide wages at or above this threshold.
They include a range of management, professional, and technical roles, such as general and operations managers, registered nurses, software developers, accountants and auditors, and other analytical and managerial positions. These occupations typically require higher levels of formal education or specialized skills and they tend to be concentrated in healthcare, finance, technology, and business services.
By contrast, many of the largest occupations in the state fall short of the middle-class threshold. These include home health and personal care aides, retail salespersons, food service workers, cashiers, customer service representatives, and administrative support roles. While wages vary across these occupations, they fall well below the level required to sustain a middle-class standard of living for a single adult.
Looking ahead, many occupations that currently provide middle-class earnings—particularly in management, analysis, and technical fields—involve tasks that artificial intelligence and other automation technologies are likely to reshape. While far more research will be needed to discern this emerging technology’s labor market impact, it could complement workers and increase their productivity. However, it could also substitute for a significant share of higher-paid roles.


5. The Interplay of Pay and Prestige
As noted in our introductory essay, the term middle-class has always included a social construct component beyond simply economic means. Throughout modern history, theorists have seen the middle class as an institution providing stability and contributing to the social order and to democratic civic life. To examine this angle, we look at occupational prestige scores that rank jobs based on their social standing or status. Drawn from survey research, these scores reflect how Americans view each profession’s respectability, skill, and societal value.1
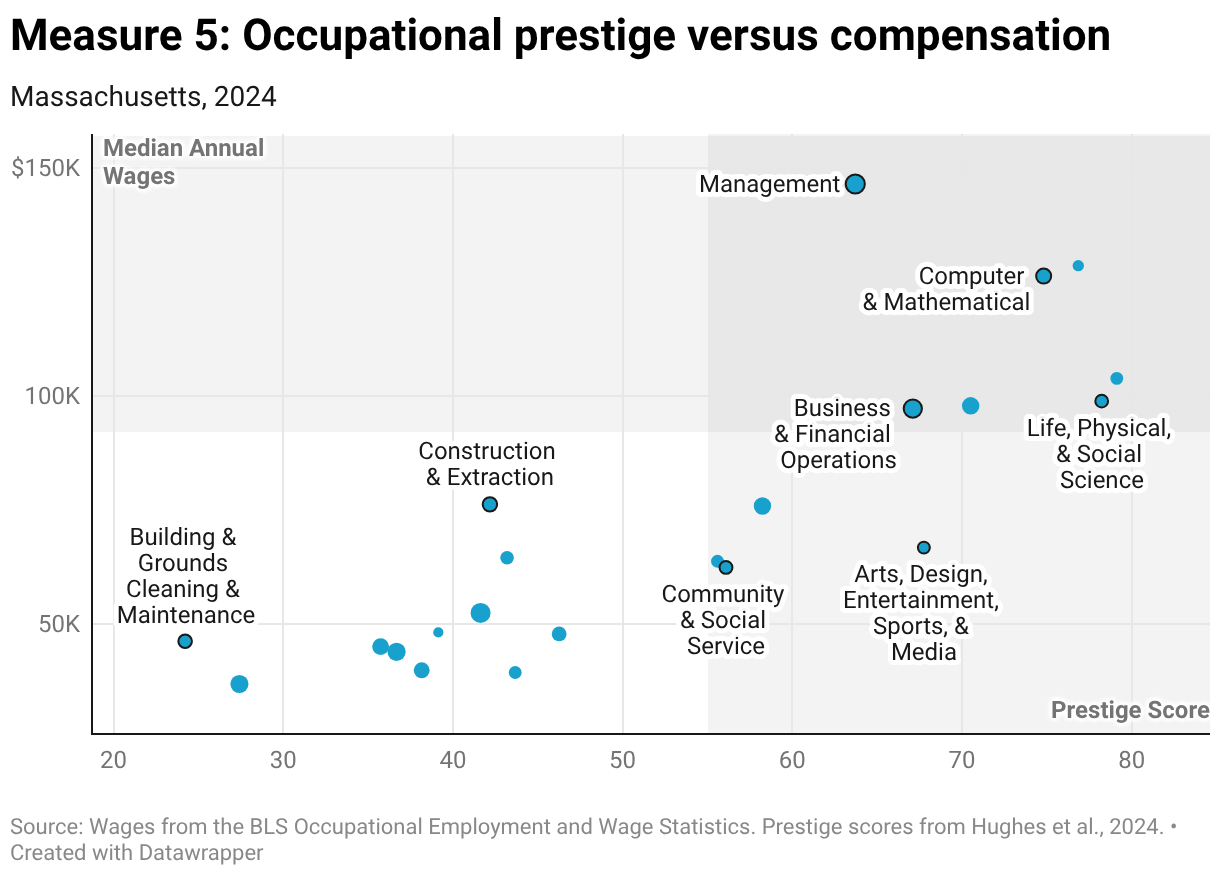
In general, social prestige and wages tend to move in tandem, but this is not always the case. In Massachusetts, about 10 percent of workers are employed in high-prestige occupations that fall below the middle-class budget threshold. Including these positions raises the share of jobs commonly perceived as middle-class to roughly 40 percent, highlighting a gap between occupational status and the income required to support a middle-class standard of living.
This mismatch is concentrated in three broad areas. First, technical roles adjacent to high-status fields—such as forensic science technicians and biological technicians—carry prestige associated with their field but typically occupy supporting or entry-level positions within occupational hierarchies and tend to offer lower pay than related roles with greater responsibilities. Second, creative and cultural professions—including designers, editors, and media production roles—combine high social recognition with relatively modest earnings. These occupations are often characterized by competitive labor markets and project-based work, which may contribute to lower pay. Third, mission-driven and public-facing roles—such as teachers, social and community service managers, and conservation scientists—are widely valued but often operate within institutional or funding constraints, features commonly associated with lower compensation relative to other occupations.
For workers in these roles, this can create a disconnect between occupational identity and economic reality: Jobs that carry the education, status, or social recognition typically associated with the middle class do not always provide sufficient income to support a middle-class standard of living. At the same time, many of these occupations offer non-monetary rewards—such as creativity, autonomy, work-life balance, or a sense of purpose—which may help sustain interest in these roles despite lower pay.
How well do benchmark households represent Massachusetts?
The benchmark households only cover a subset of the population. To the extent that cost pressures are changing household structures, this approach could underestimate the stress that rising costs are placing on Massachusetts residents and how our middle-class shares compare to other states.
In 2024, households corresponding to the benchmark structures made up roughly 64 percent of households in Massachusetts and 63 percent of households in the US. In Massachusetts, single-adult households accounted for about 28 percent of households, while two-adult households composed of couples or cohabiting partners without children accounted for another 27 percent; one- or two-adult families with two children represented another 10 percent of households.
The remaining 36 percent of households in Massachusetts fell into non-benchmark categories, such as shared living arrangements among unrelated adults, multigenerational households, households with adult children living at home, and households with one child or more than two children.
From 2009 to 2024, the share of Massachusetts households living with adult children increased by roughly 2.7 percentage points, closely tracking the national trend. The share of households with children declined, including a drop of about 2.5 percentage points in families with two children and about 1.8 percentage points in families with one child.
While benchmark household structures still remain the most common, they have become modestly less prevalent over time in ways that are indicative of increasing cost pressures.


- Bradley T. Hughes, Sanjay Srivastava, Magdalena Leszko, David M. Condon; “Occupational Prestige: The Status Component of Socioeconomic Status.” Collabra: Psychology 16 January 2024. ↩︎
The Massachusetts Middle Class Status Report
This special anniversary report will be released by chapter. Please check back for future releases.
Chapters
Introducing the Massachusetts Middle Class Status Report
Component 1: The Middle-Class Budget by Household Type
Component 2: Who Can Afford a Middle Class Lifestyle
Component 3: Work, Leisure Time, and Civic Engagement
Component 4: Economic Security
Component 5: Economic Mobility and the Geography of the Middle Class

The Massachusetts Middle Class Status Report
January 28, 2026